


Introduction
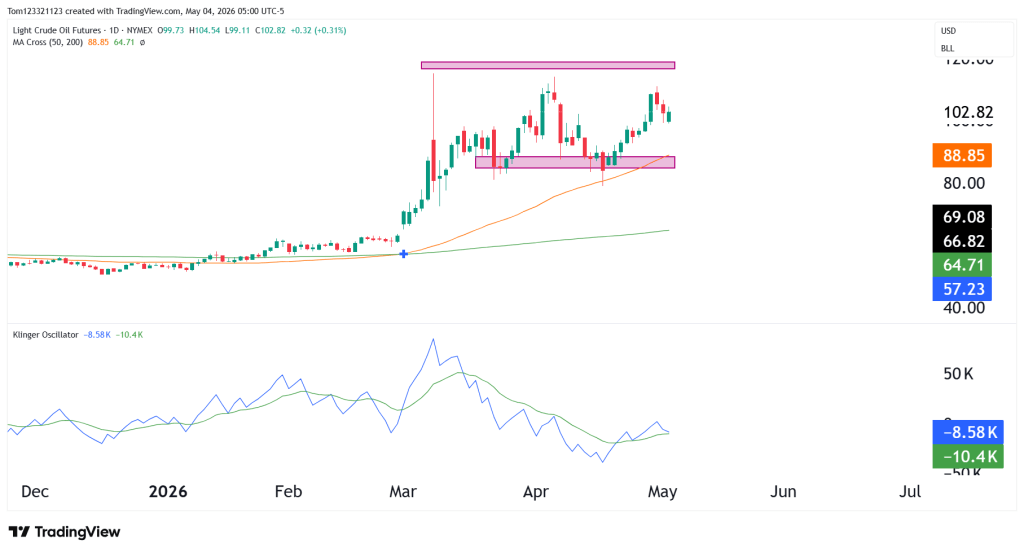
After holding the $88–90 support zone and working higher over the past couple of weeks, price has now pushed back toward the $102–105 resistance area, which has already rejected price once before.
So structurally, not much has changed at the highest level. This is still a market trading inside a defined range. What has changed is how price has moved within that range. Instead of fading after the last rejection, crude stabilized, built a base, and made its way back up. That tells you buyers are still active, even if they haven’t taken control yet.
Crude’s move back above $100 doesn’t appear to be driven by a single headline, but rather a shift in how the market is pricing risk. While tensions in the Middle East had briefly faded from focus, recent developments suggest the situation remains unresolved, particularly around ceasefire stability and key shipping routes. As a result, some of the earlier risk premium that was priced out is now being added back in, helping support crude even without a sharp escalation.
Price Behavior
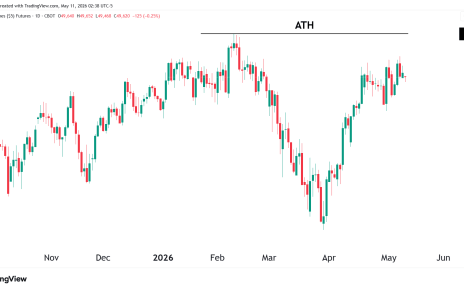
Price pushed up from the support at $87 after testing the level back on the 20th of April. The price rallied 31% since then, has pulled back slightly, and there is a fight between buyers and sellers. If the bears are stronger, we will see the price move back to the support again, which will likely lead to a strong consolidation zone. If bulls are too strong, then we will see a test of the recent all-time high of $115. This is all mostly being determined by the developments in the Middle East, and technicals are playing a smaller role overall.
Key Levels That Matter
The range is still clearly defined, and that makes the levels straightforward.
- Resistance: 102–105 (current test area)
- Support: 88–90 (established demand zone)
- Secondary support: ~83–84 (50-day area)
Right now, everything comes down to how price behaves at 102–105.
A strong break and hold above that area would shift the structure back into trend continuation. Another rejection would keep the range intact and likely send price back toward the middle or lower end.
Scenarios and Probabilities
| Scenario | Description | Estimated Probability |
|---|---|---|
| Range | Rejection at 102–105 → rotation back toward 90 | 40% |
| Breakout | Clean break above 105 → move toward 110+ | 35% |
| Pullback Hold | Dip toward 92–95, then continuation higher | 25% |
The market is leaning slightly more constructively than before, but it still needs to prove it can clear resistance.
Possible Trades
Longs start to make more sense now, but not blindly into resistance.
The cleaner setups are either:
- A pullback that holds above 92–95, confirming higher support
- Or a break and hold above 105, showing real strength
Shorts still have a place if price clearly rejects the 102–105 zone, especially if momentum fades quickly. That would reinforce the idea that the range is still in control.
This analysis is for educational and informational purposes only and does not constitute trading advice. Futures and forex trading involve significant risk and may not be suitable for all investors. Always conduct your own research before making trading decisions.
