


Introduction
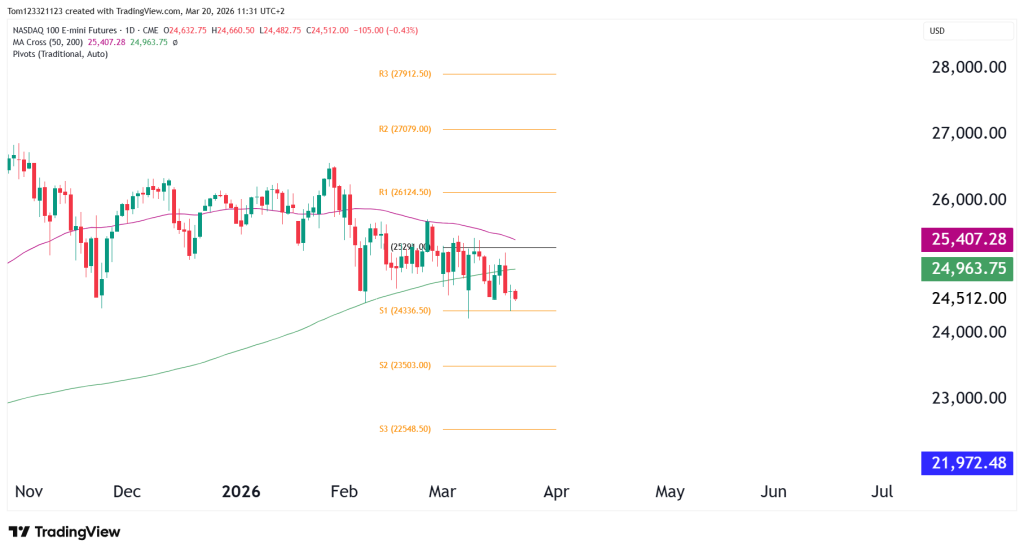
Nasdaq futures (NQ) are currently in a difficult position, sitting just above a key support zone near 24,500, while remaining below the 50 and 200-day moving averages.
The market is mostly consolidating at this period of uncertainty surrounding the war in the Middle East. Positioning correctly is not very easy in these conditions because of the lack of clear direction, but there are some technicals we can look at to help us move forward.
What Has Changed Recently
Over the past few weeks, NQ has failed to reclaim the 50-day moving average or the 25,800 region. It has started forming lower highs and has drifted back toward support at 24,500. With that said, price is not collapsing by any means and is currently consolidating. If we see some changes in the Middle East, which could lead to a weaker Dollar, we might see a possible bullish move in equities.
Market Structure & Trend
The daily trend is starting to lean bearish.
Price has dropped below the 50-day moving average, which sits around 25,408, and is now testing the 200-day moving average near 24,960. At the same time, it’s pressing down toward a key support level around 24,500.
What matters here is the shift in behavior. The market is no longer pushing into clear higher highs. Instead, it’s moving sideways to lower and having trouble getting back above important levels. That’s often an early sign that momentum is fading.
In simple terms, the market may be moving out of a strong uptrend and into a more corrective or distribution phase.
Key Technical Levels
Resistance
25,300 – 25,500 (50-day MA region)
This is the most important resistance zone.
26,000
Major prior high / rejection zone. A break above would shift structure back bullish.
Support
24,500 (Current level)
Key horizontal support and current battleground.
24,300 (S1 pivot)
Next support level if breakdown begins.
23,500 – 23,000
Deeper support zone and potential downside target if selling accelerates.
Trade Positioning
- If price rejects 25,300–25,500, continuation lower becomes more likely.
- If price breaks below 24,500, expect momentum to expand to the downside.
- If price reclaims 25,500 and holds, the bearish structure weakens.
Probability Table
| Scenario | Description | Estimated Probability |
|---|---|---|
| Bearish Breakdown | Break below 24,500 leads to move toward 24,300 → 23,500 | 45% |
| Range Continuation | Price holds between 24,500–25,500 in choppy conditions | 35% |
| Bullish Reclaim | Price reclaims 25,500 and moves toward 26,000 | 20% |
Final Takeaway
The trend is no longer clearly bullish, and price is starting to show weakness as it tests support. The 24,500 level stands out as a key area. What happens there will likely decide whether the market holds steady or slips into a deeper pullback.
Right now, this isn’t a clean trending market. It’s more about reacting to what price does at important levels rather than trying to predict the next move. Price is essentially waiting for a reason to move.
Once this range breaks, the next move could be fast and decisive.
For traders, the main takeaway is to stay patient and let the market show its hand. In this kind of environment, it’s usually better to react to confirmation rather than guess direction early. Moves that come out of tight ranges like this can be sharp, so timing and discipline matter more than usual.
This analysis is for educational and informational purposes only and does not constitute trading advice or a recommendation to buy or sell any futures contracts. Futures trading involves significant risk and may not be suitable for all investors. Always conduct your own research and consult with a licensed financial professional before making trading decisions.

