

Learn what a false breakout is in trading, how to identify false breakout patterns, and how traders use the false breakout trading strategy with chart examples and technical indicators.
Introduction
Breakouts are one of the most common concepts in technical analysis. Traders watch for price to move above resistance or below support, expecting momentum to continue in that direction.
However, not every breakout leads to a trend.
Sometimes the market moves beyond a significant support or resistance level only to quickly reverse. This situation is known as a false breakout in trading, and traders who know how to take advantage of them can profit on quick reversal moves with high risk-to-reward ratios.
In this guide, we’ll explain what a false breakout is, how to identify false breakout patterns, and how traders use technical analysis tools such as RSI divergence and price action to confirm these setups.
What Is a False Breakout in Trading?
A false breakout occurs when price breaks above resistance or below support but fails to maintain momentum and quickly reverses back into the previous trading range.
These moves often trap traders who entered the breakout expecting the market to continue trending. There are also a lot of orders specifically stop losses at these levels, which can lead to a quick move where traders think it is a breakout, only to see it reverse quickly. This creates short-term panic in the market as traders see that an important level has not broken with conviction, and so they quickly exit or reverse their positions.
False breakouts are sometimes referred to as:
- Bull traps
- Bear traps
- Failed breakouts
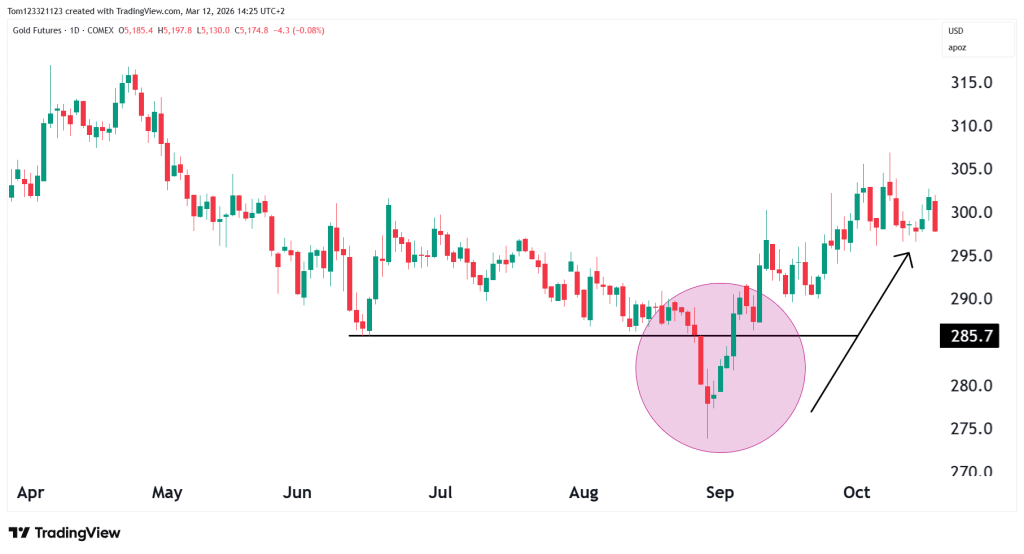
Table of Contents
- False Breakout Definition in Trading
- Why False Breakouts Happen
- How to Identify a False Breakout in Trading
- False Breakout Candlestick Pattern
- The False Breakout Trading Strategy
- Indicators That Help Confirm False Breakouts
- Common Mistakes When Trading False Breakouts
- Risk Reward Ratios In The False Breakout
- Key Takeaways
- FAQ
1. False Breakout Definition in Trading
The false breakout definition in trading refers to a situation where price moves beyond an important support or resistance level but fails to continue in that direction.
Instead of forming a new trend continuation, price reverses and moves back inside the previous range.
In technical analysis, breakouts normally signal strong momentum. When a breakout fails, traders who entered the trade may quickly exit their positions, which can accelerate the move in the opposite direction. For example, if the market looks like it will have a bullish breakout but there is not enough buying power, traders can enter short positions to take advantage of the ‘lack of follow-through.’
False breakout patterns often occur near:
- Major support and resistance levels
- Trendline breaks
- Chart patterns
- Consolidation ranges
Because these levels attract a large number of orders, they frequently become areas where false breakout trading patterns appear.
2. Why False Breakouts Happen
Understanding why false breakouts occur can help traders avoid common traps.
Markets are driven by liquidity, and price often moves around areas where traders place large numbers of orders.
Several factors can cause a false breakout in trading.
Liquidity Hunting
Large market participants may push price beyond obvious levels to trigger stop-loss orders. Once those orders are triggered, the market may reverse direction.
Weak Breakout Momentum
Breakouts without strong participation often fail. If volume or momentum is weak, the breakout could quickly reverse.
Range-Bound Markets
False breakouts occur more frequently in sideways markets where there is no strong trend direction.
Overcrowded Trades
When many traders expect the same breakout, the market sometimes moves in the opposite direction. It is the reason why successful traders don’t share their strategies with others, because the more that trade the same system, the less of an edge it has. In breakouts, if too many participants expect the same thing, then the same possibility is there.
3. How to Identify a False Breakout in Trading
Learning how to identify false breakout setups is an important skill for traders who rely on technical analysis.
Several signs can point toward a breakout that is going to fail:
Quick Reversal After the Breakout
One of the clearest signs of a false breakout is when price quickly returns inside the previous trading range after breaking a key level.
For example:
- Price breaks above resistance
- Traders enter long positions
- The market quickly falls back below resistance
This is a common false breakout example.
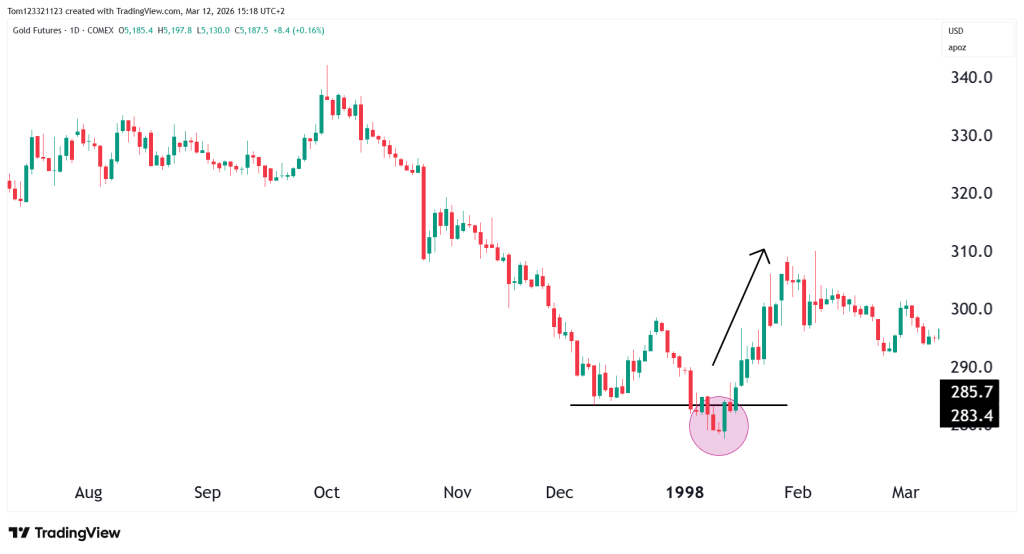
In this example, there is a possible long entry which can be taken when it is clear the breakout is a false one. Of course, there are no guarantees in trading, only trying to be on the side of higher probabilities.
Once the green candle appears, it is a sign that the breakout does not have enough selling pressure. We can see as well that the false breakout happens after a lengthy downtrend, which adds more strength to the false break because it shows that the selling pressure is not strong enough to continue with the downtrend.
Weak Breakout Volume
If volume remains low during the breakout, the move more often than not lacks conviction.
Low participation can signal that the breakout is more likely to fail. There is also the possibility that the volume comes later, and it’s important to watch for that.
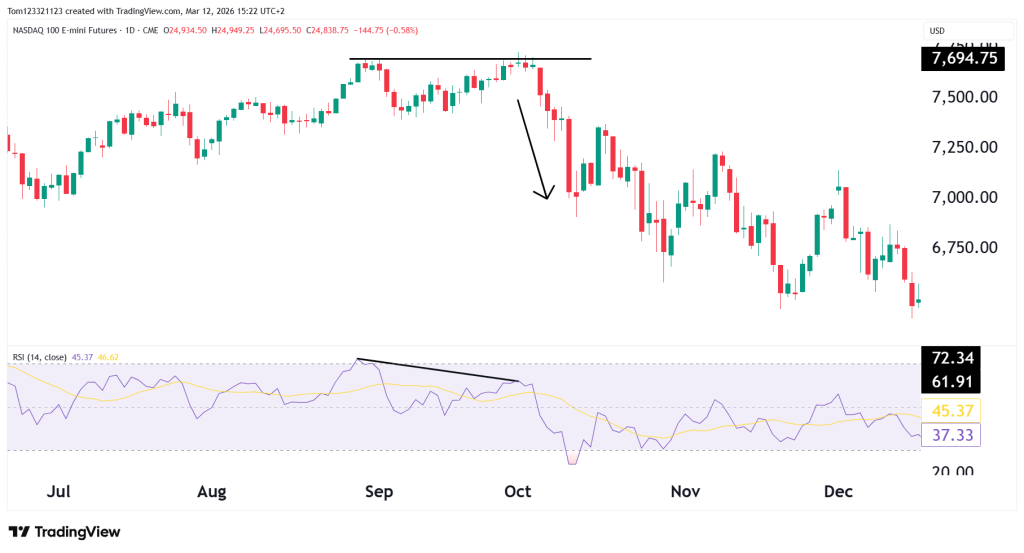
RSI Divergence False Breakout Confirmation
Momentum indicators such as the Relative Strength Index (RSI) can help confirm potential false breakouts.
For example, if price makes a higher high while RSI makes a lower high, it may signal weakening momentum.
This type of divergence can indicate that the breakout is losing strength.
4. False Breakout Candlestick Pattern
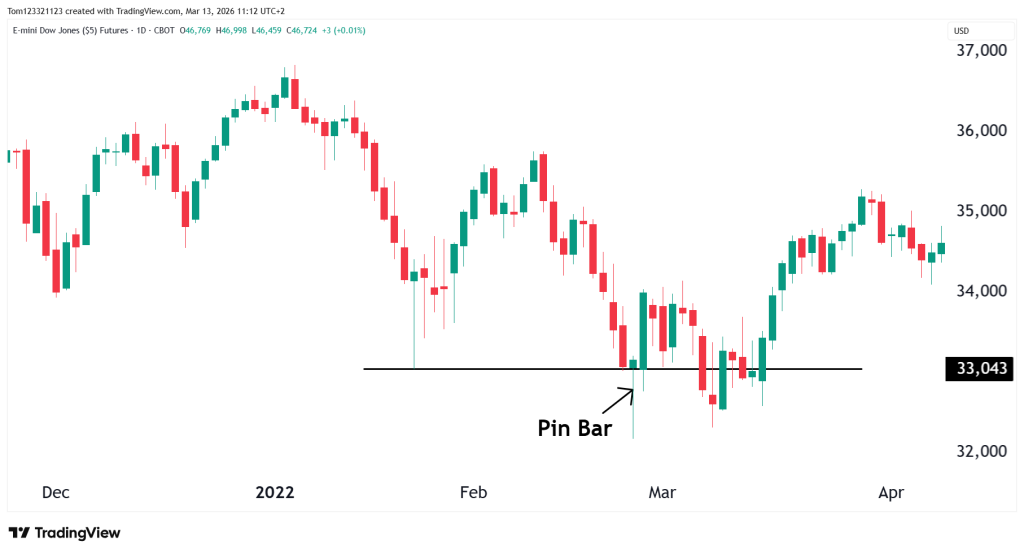
Certain candlestick formations often appear when a breakout fails and can be a great way of entering a trade in the opposite direction of the expected breakout.
Some of these:
- Pin bars
- Shooting star candles
- Bearish or bullish engulfing candles
- Long wick rejection candles
5. The False Breakout Trading Strategy
The false breakout trading strategy focuses on trading the reversal after a breakout fails.
Instead of entering during the breakout itself, traders wait for confirmation that the breakout has failed.
A typical false breakout strategy follows these steps:
Step 1: Identify Key Support or Resistance
Look for price levels where the market has previously reversed multiple times.
These areas often attract a large number of orders.
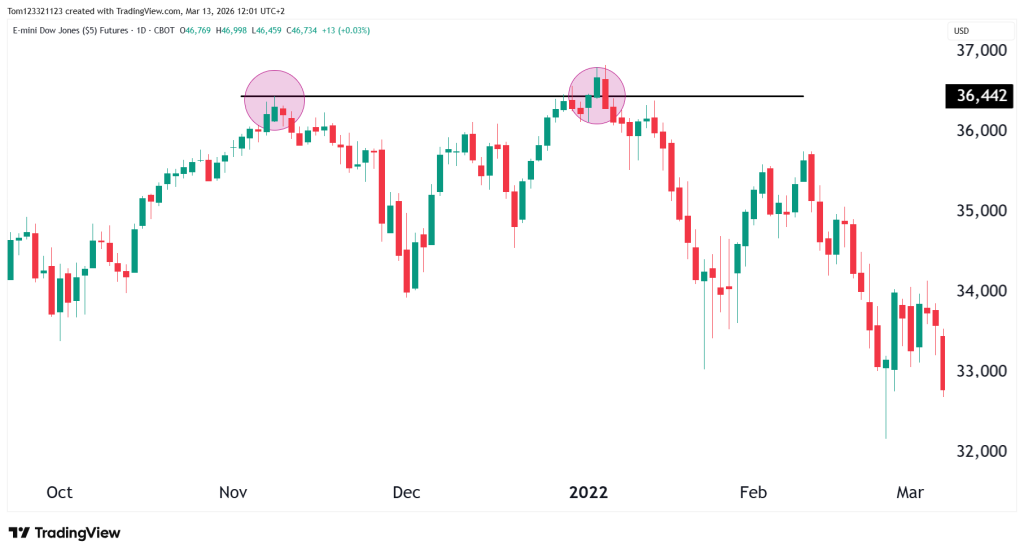
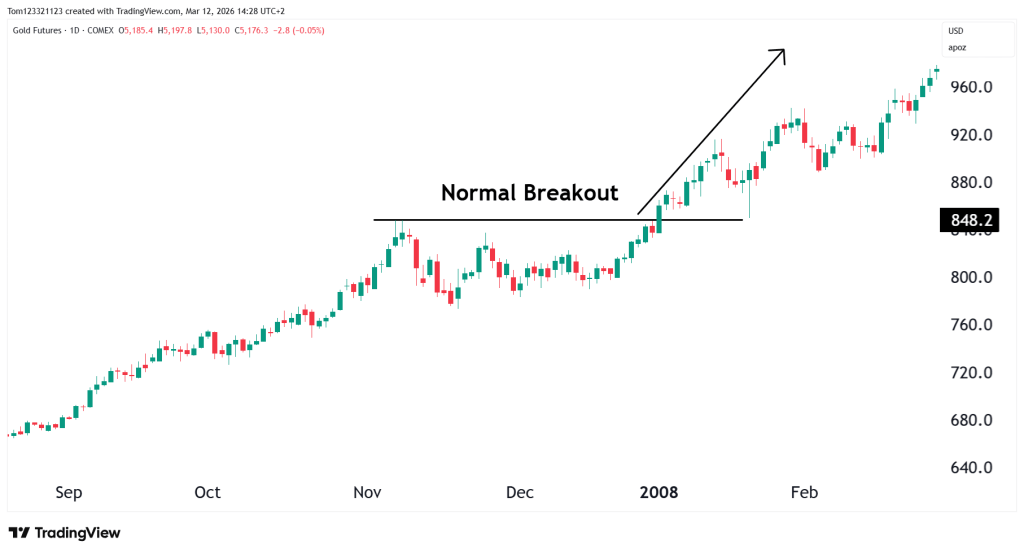
Step 2: Wait for the Breakout
Price moves above resistance or below support, triggering breakout trades.
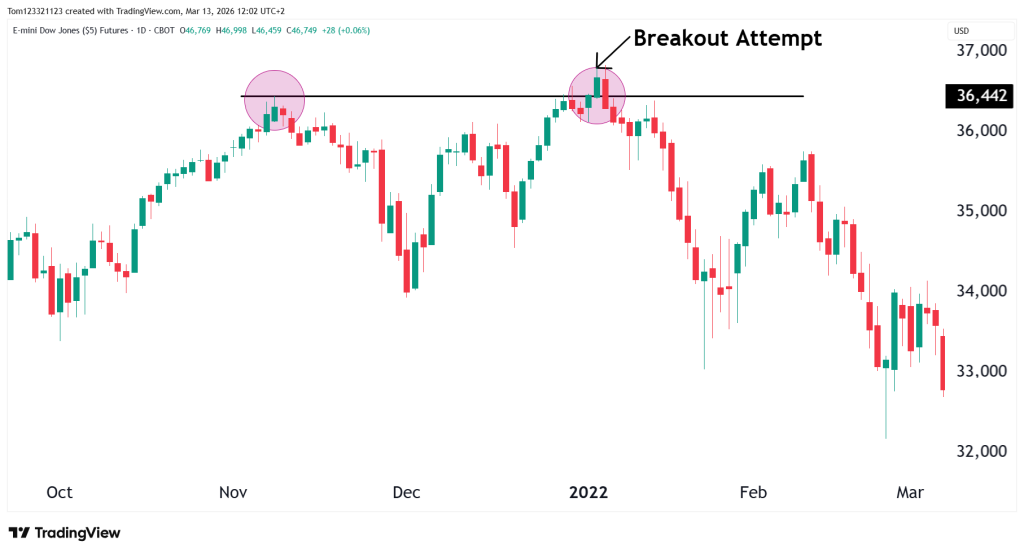
Step 3: Watch for Rejection
If price quickly moves back inside the range, the breakout could have failed but keep in mind that there can be another attempt.
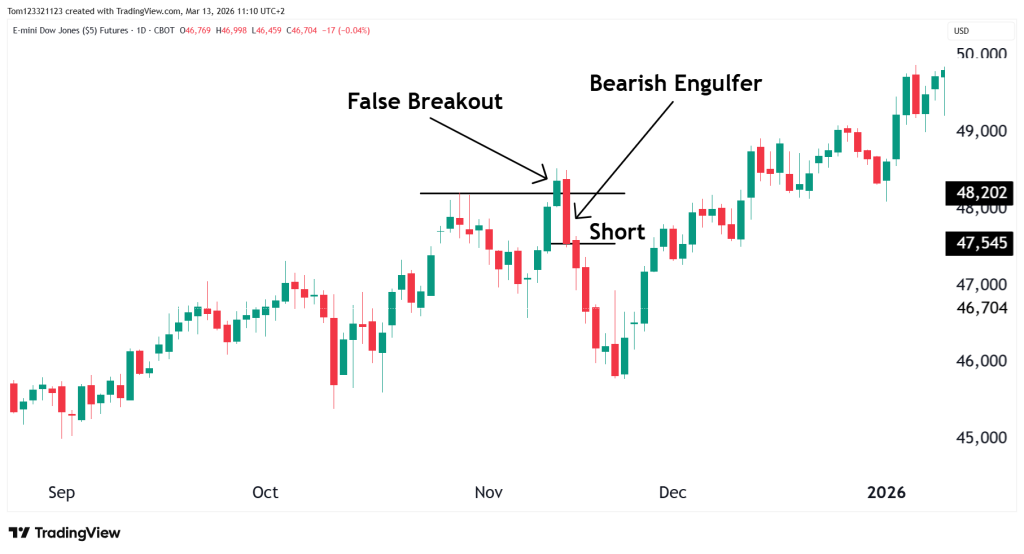
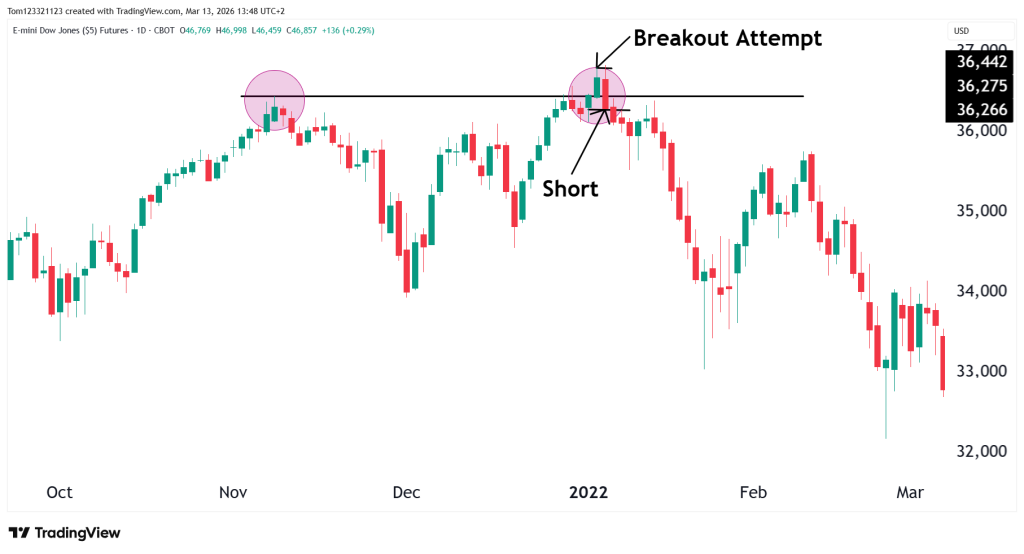
Step 4: Enter the Opposite Direction
Once confirmation appears, traders enter a trade in the opposite direction of the breakout.
For example:
- Price breaks above resistance
- The breakout fails
- Traders enter short positions
6. Indicators That Help Confirm False Breakouts
False break (or false breakout / fakeout) strategies work best when you combine price action with confirmation indicators. The goal is to detect when the breakout lacks real momentum and price is likely to reverse back into the range.
Below are (in our opinion) two of the most effective indicators combined with false break setups.
Relative Strength Index (RSI)
We have already spoken about the RSI in this article and how it can be used but it is such a reliable indicator for false breaks that we will look at it again.
A great way to confirm false breaks is when there is divergence on the RSI indicator like we can see in the chart below.
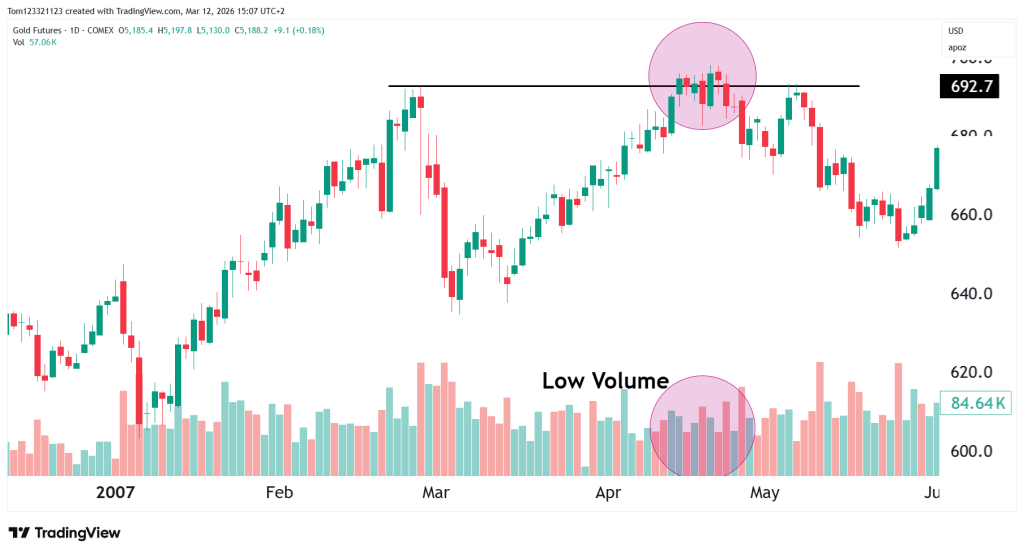
Volume Indicators
Volume is one of the strongest ways to confirm whether a breakout is confirmed or if it could fail. If a breakout occurs but the follow-through volume is weak, the chances are higher that it will reverse and fail. High volume shows that there is more interest in the direction of the breakout, but keep in mind that the initial volume might be high because of an accumulation of orders at that level, but the follow-through is what is important. Volume needs to continue to pick up as the break happens; if it does not, then it is likely a false break.
Notice in the chart below that there is no volume surge when price breaks above the level, and it does not pick up even as the candles accumulate at that level. This is a very high probability false breakout setup.
7. Common Mistakes When Trading False Breakouts
There are some fundamental aspects that traders need to follow when trading the false break candle strategy.
These are some of the most common mistakes made when trading this strategy:
Entering Too Early
Some traders assume a breakout will fail before confirmation appears. Entering as the candle breaks out is a high-risk method, even though it can increase the risk-reward ratio. It is more reliable to wait for a candle confirmation.
Ignoring Market Structure
False breakouts occur more frequently in sideways markets than in strong trending conditions.
Poor Risk Management
Even high-probability setups can fail.
Using proper position sizing and stop-loss levels can help manage risk. Traders should avoid the mindset of ‘this is certainly a false breakout’ and enter with too much risk on the board.
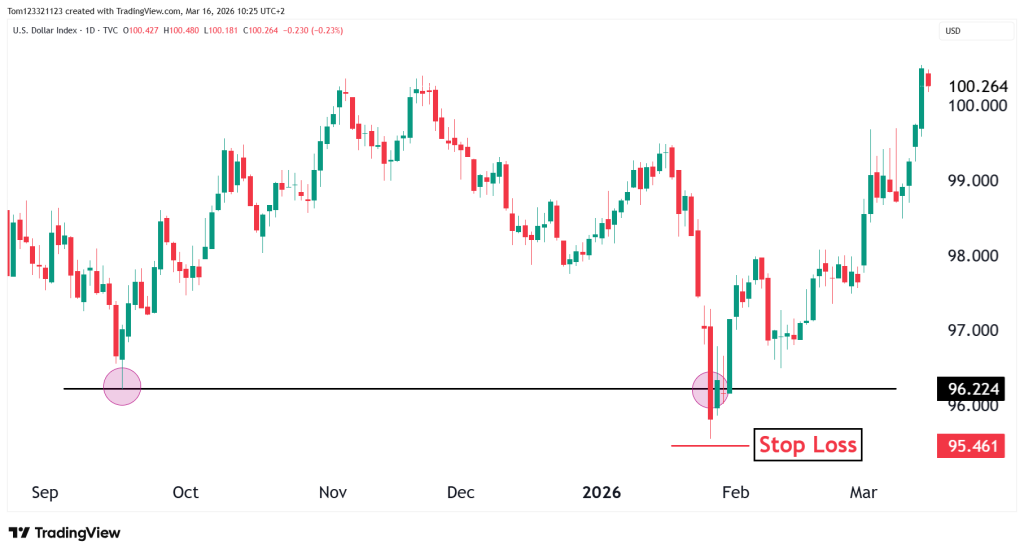
8. Risk Reward Ratios In The False Breakout
There are a few reasons why the false breakout candle strategy can be so useful if traded well. One is that there is precise placement for stop losses, which is always at the high of a bullish false break or at the low of a bearish false break. If that stop loss is hit, traders can even reverse their position as the probabilities swing in favour of it being a confirmed breakout.
Risk-to-reward ratios can also be high when trading this setup. There are many ways to set targets; one is a simple 2:1 or 3:1 risk-to-reward ratio. Another way is to trail your stop in case the market trends in the new direction. Traders can also target the next support/resistance level, which usually gives at least a 3:1 risk-to-reward ratio.
Key Takeaways
- A false breakout in trading occurs when price breaks a key level but quickly reverses.
- These moves often trap traders who entered the breakout expecting continuation.
- False breakouts frequently occur around support and resistance levels.
- Traders often use RSI divergence, candlestick rejection patterns, and volume analysis to confirm these setups.
- The false breakout trading strategy focuses on trading the reversal after the breakout fails.
Test The False Break Trading Strategy Today!
FAQ: False Breakouts in Trading
What is a false breakout in trading?
A false breakout in trading occurs when price moves beyond a support or resistance level but quickly reverses and returns to the previous trading range.
How do you identify a false breakout?
Traders often identify false breakouts by watching for quick reversals, low breakout volume, RSI divergence, and rejection candlestick patterns.
What is a false breakout strategy?
A false breakout trading strategy involves entering a trade in the opposite direction after a breakout fails and price returns inside the previous range.
Are false breakouts common?
Yes. False breakouts are common in financial markets, especially during consolidation or range-bound conditions.
What indicators help confirm a false breakout?
Common confirmation tools include RSI divergence, volume indicators, candlestick rejection patterns, and support and resistance analysis.
