

Introduction
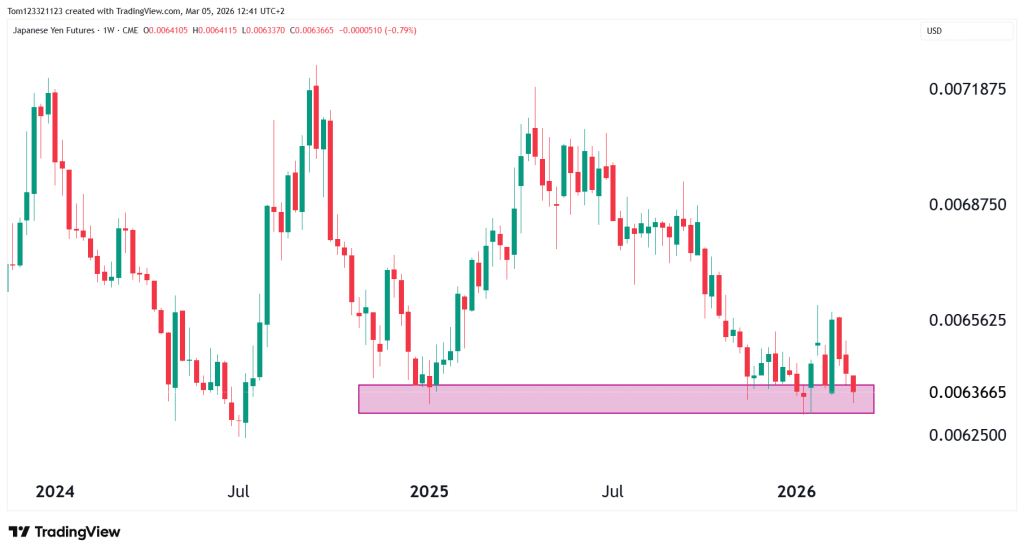
The reason we are looking into the Japanese Yen futures (JPY) today is that there could be a high probability of a bullish trade. We are currently testing a major long-term support zone near 0.00630–0.00635, an area that has held since July 2024. With the current situation in the Middle East, this could be an opportunity for traders willing to take a risk but for a potential high reward.

Main Chart Features
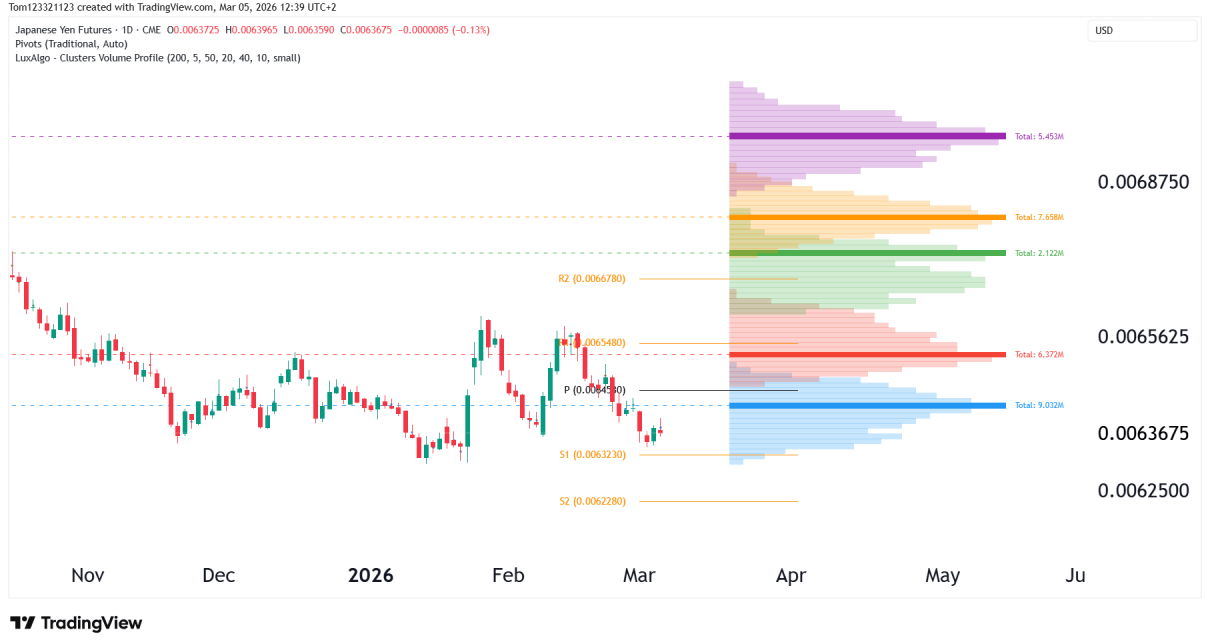
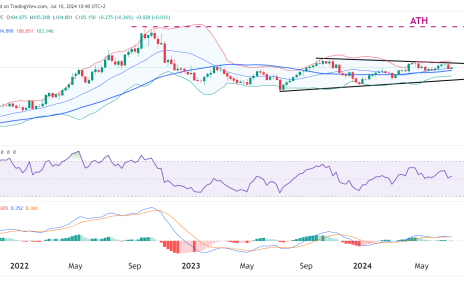
Since mid-2025, the chart has been forming lower highs and forming a big descending triangle, but the low has not been taken out, which is why it could be a strong bullish opportunity.
Looking at volume data, on the volume profile indicator, the highest volume is around current levels, showing just how much buying power is here.
Market Structure & Trend
Weekly Chart – Major Support Test
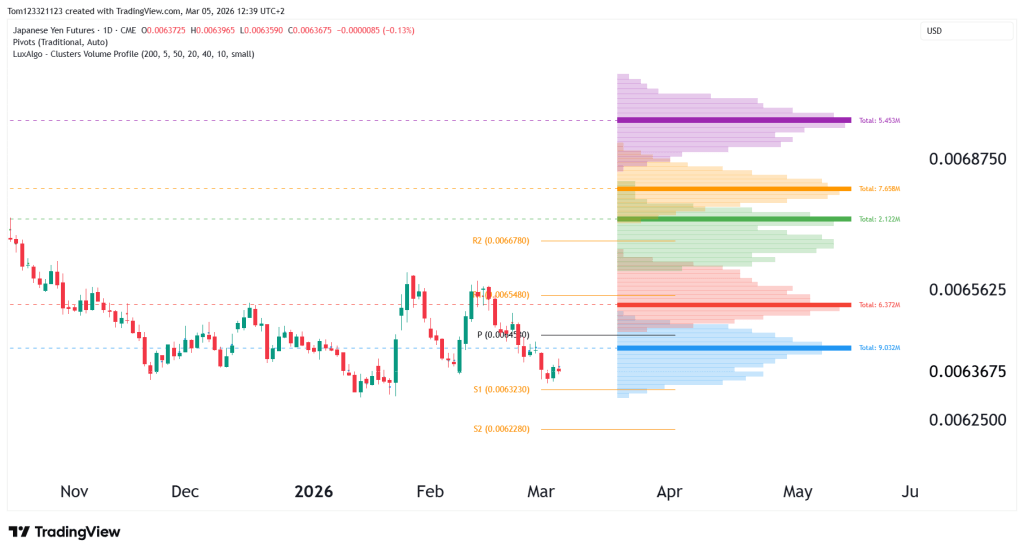
Key Technical Levels for JPY
Immediate Resistance
0.00644 – Pivot Level
- Current pivot resistance
- First level bulls must reclaim
0.00655
- Major resistance
- Previous swing highs
- Repeated rejection zone
A break above this level would likely trigger short covering and a momentum rally.
0.00667 – 0.00670
- R2 pivot region
- Upper liquidity zone
Support
0.00630 – 0.00633
- Major weekly demand zone
- Long-term structural support
This is the most important level on the chart.
Scenarios Going Forward
Safe-Haven Rally
If geopolitical tensions rise sharply, markets usually shift into what traders call a risk-off environment. When uncertainty increases, investors tend to move money out of riskier assets and into safer ones. This shift often creates strong moves across currencies, commodities, and equities.
The Japanese yen is one of the assets that tends to benefit during these periods. As global risk rises, demand for safer currencies increases, which can lead to a noticeable strengthening in the yen. If global equity markets begin to sell off or volatility rises, that move can accelerate quickly.
In this scenario, price could rebound toward the 0.00655 to 0.00670 area. Moves like this often happen quickly during risk-off events because traders adjust their positions at the same time and liquidity can shift rapidly across the market.
Range Continuation
Support holds but the broader trend remains weak.
Price oscillates between:
0.00630 – 0.00655
This would continue the sideways consolidation seen since late 2025.
Bearish Breakdown
If the support zone fails:
- Price breaks 0.00630
- Momentum accelerates lower
- Next target near 0.00610
This would represent a structural continuation of the longer-term downtrend.
Estimated Probability Table
| Scenario | Description | Probability |
|---|---|---|
| Range continuation | 0.00630–0.00655 consolidation | 40% |
| Safe-haven rally | Bounce toward 0.00670 | 35% |
| Bearish breakdown | Drop toward 0.00610 | 25% |
Final Takeaway
Japanese Yen futures are currently sitting at one of the most important technical levels on the chart.
The 0.00630–0.00635 support zone has repeatedly acted as a demand area, and the market is once again testing it.
If the level holds, a short-term rebound toward 0.00655 is possible. However, the broader trend remains weak due to ongoing monetary policy divergence and carry trade pressure.
War-related developments could significantly influence the next move. A sudden escalation in geopolitical tensions could trigger safe-haven flows and rapid yen strengthening, while stable global conditions may allow the broader downtrend to continue.
For now, the market appears to be at a decision point between support defense and trend continuation.
This analysis is for educational and informational purposes only and does not constitute trading advice or a recommendation to buy or sell any futures contracts. Futures trading involves significant risk and may not be suitable for all investors. Always conduct your own research and consult with a licensed financial professional before making trading decisions.