


Introduction
Nasdaq-100 futures have continued to rally, with 7 out of 9 candles in the green for the past sessions. Price is 3.2% away from the all-time high of 26,404, and bulls will be trying to push through that in the next few sessions.
Let’s break down the technicals and see what they tell us.
Technical Overview
NQ Daily Chart Technical Analysis
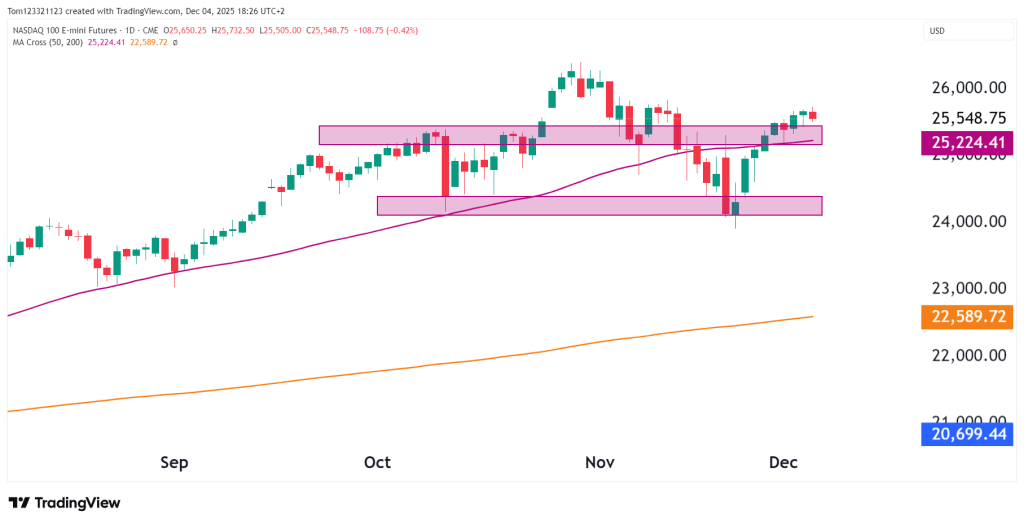
NQ has rallied sharply from the late-November lows near 24,000–24,200, where the index bounced cleanly off a well-defined demand zone. That zone acted as the “line in the sand” for buyers and has once again proven to be a strong support floor.
Since then, price has climbed back into the 25,200–25,550 resistance cluster — an area that has repeatedly served as both support and resistance over the past two months.
Retest of the 50-day moving average succeeded
NQ reclaimed the 50-day MA at 25,224, and has now retested it from above. This is an encouraging sign for bulls and keeps the short-term trend biased upward.
Any daily close below the 50-day MA, however, would weaken the structure again.
Price is pressing into a major supply zone
The zone between 25,350–25,550 continues to cap upside momentum. Sellers have defended this region multiple times.
A clean breakout above 25,550 would be the next bullish trigger, potentially opening the door for a retest of 26,000–26,300.
Higher lows forming, but momentum is moderating
The current pullback is shallow and controlled, indicating buyers are still active. However:
- The last two candles show rejection wicks.
- RSI has softened from recent highs but remains neutral at ≈53, giving markets room to expand in either direction.
Momentum remains cautiously bullish unless RSI drops back under 45.
Key Technical Levels
Resistance
- 25,350–25,550 → Immediate supply zone
- 26,000–26,100 → Next breakout region
- 26,300 → November swing high
Support
- 25,224 → 50-day MA / first support
- 24,850–25,000 → Short-term support shelf
- 24,100–24,250 → Strong demand zone and last week’s reversal area
- 22,590 → 200-day MA (major trend support)
Probability Table (Next 2–3 Weeks)
| Scenario | Estimated Probability | Notes |
|---|---|---|
| Continuation toward 26,000–26,300 | 50% | Higher lows, reclaimed MAs, shallow pullback. |
| Sideways consolidation between 25,000–25,550 | 35% | Resistance cluster may cap upside temporarily. |
| Breakdown below 25,000 → revisit 24,200 demand | 15% | Would require tech weakness or macro risk-off shift. |
Summary
NQ is pausing after a strong rebound, with price now testing a key resistance band between 25,350–25,550. The trend remains constructive as long as the index holds above the 50-day moving average, and the series of higher lows supports a continued upside bias.
The critical question for the coming sessions is whether buyers can push through 25,550, which would likely confirm the next leg of the advance toward 26,000+. Failure to clear that level could result in short-term consolidation.
This analysis is for educational and informational purposes only and does not constitute trading advice or a recommendation to buy or sell any futures contracts. Futures trading involves significant risk and may not be suitable for all investors. Always conduct your own research and consult with a licensed financial professional before making trading decisions.

