


Introduction
The E-mini Russell 2000 futures (RTY) has followed the S&P 500, building on last week’s recovery as buyers continue to defend support levels and the 50 day moving average. The small-cap index is also aiming at targetting its all-time high (ATH) at 2,559 as bulls attempt to swing momentum back in their favour after a short term consolidation.
Technical Overview
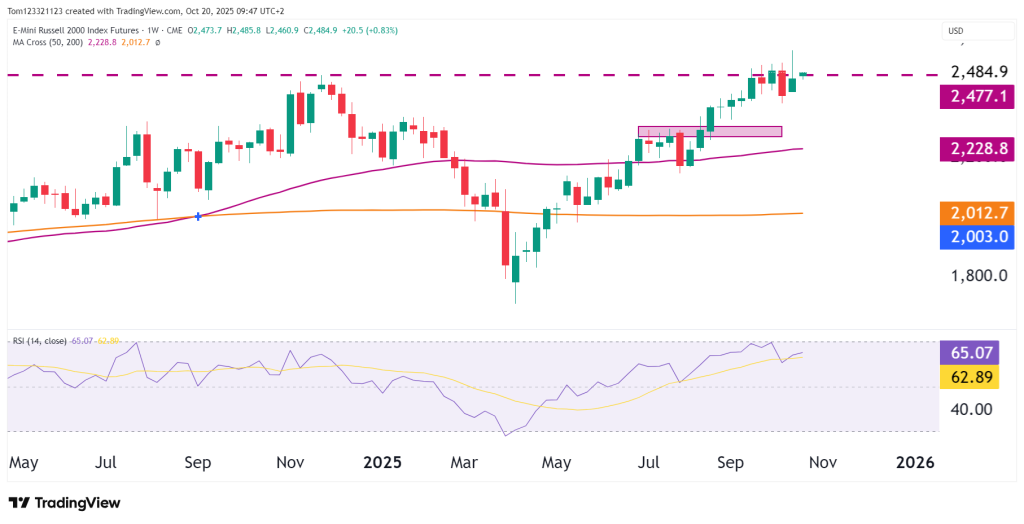
The weekly chart shows a steady uptrend, with RTY making higher lows since April. The price is holding above both the 50-week (2,228.8) and 200-week (2,012.7) moving averages, confirming long-term strength.
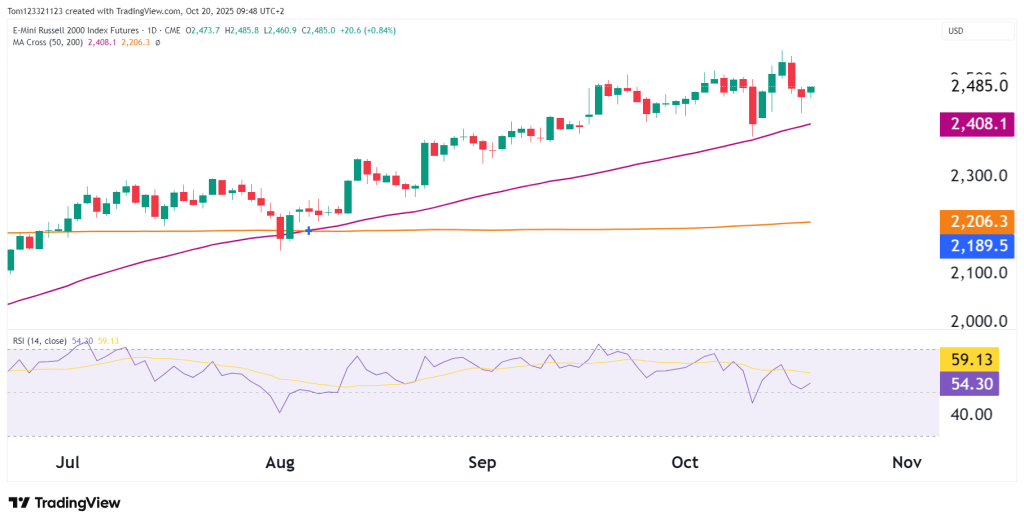
On the daily chart, the index is sitting above the 50-day moving average (2,408.1), which has held firm as support throughout October. This level has been a solid base for buyers.
Recent price action shows tight trading near resistance, suggesting the market is building up for a breakout. A strong move above 2,490–2,500 could lead to new highs. But if it drops below 2,400, a deeper pullback might follow.
RSI & Momentum
The RSI (14) sits around 54.3 on the daily and 65.0 on the weekly, showing balanced momentum after the earlier pullback. The indicator suggests there’s room for upside continuation.
This neutral-to-bullish RSI stance aligns with price structure resilience—buyers remain in control.
Key Technical Levels
| Type | Level | Description |
|---|---|---|
| Resistance 1 | 2,485–2,500 | Current all-time high zone |
| Support 1 | 2,408 | 50-day MA / near-term support |
| Support 2 | 2,300–2,320 | Prior consolidation zone from August |
| Major Support | 2,228 | 50-week MA; key trendline support |
Probability Table (Next 2–3 Weeks)
| Scenario | Estimated Probability | Notes |
|---|---|---|
| Breakout above 2,485–2,500 | 55% | Trend alignment and positive structure favor continuation. |
| Sideways consolidation between 2,400–2,480 | 30% | Market consolidation phase before next leg higher. |
| Rejection and pullback below 2,400 | 15% | Would weaken short-term momentum but preserve long-term uptrend. |
Fundamentals
Small-cap stocks are recovering as U.S. Treasury yields have steadied and investors are shifting focus to domestic sectors. This comes after strong consumer spending and hopes that the Fed will stay supportive if inflation keeps easing.
Still, there are risks. Interest rate swings and possible changes in government spending due to new budget talks in Washington could affect the market. Earnings from regional banks and industrials will also be key this quarter, since they make up a bigger part of the Russell 2000 than in tech-heavy indexes like the Nasdaq.
If these earnings come in strong, small-cap stocks could lead the market into Q4, especially since they’re closely tied to the U.S. economy.
Summary
The Russell 2000 futures are showing renewed strength, holding firm near all-time highs and maintaining their long-term bullish structure. With support from the 50-day moving average and steady RSI levels, the index appears ready for a potential breakout above 2,485, provided broader market sentiment and earnings momentum stay constructive.
For now, bulls retain control, but a rejection near resistance would likely result in another consolidation phase above 2,400 before the next directional move.
This analysis is for educational and informational purposes only and does not constitute trading advice or a recommendation to buy or sell any futures contracts. Futures trading involves significant risk and may not be suitable for all investors. Always conduct your own research and consult with a licensed financial professional before making trading decisions.


