

Introduction
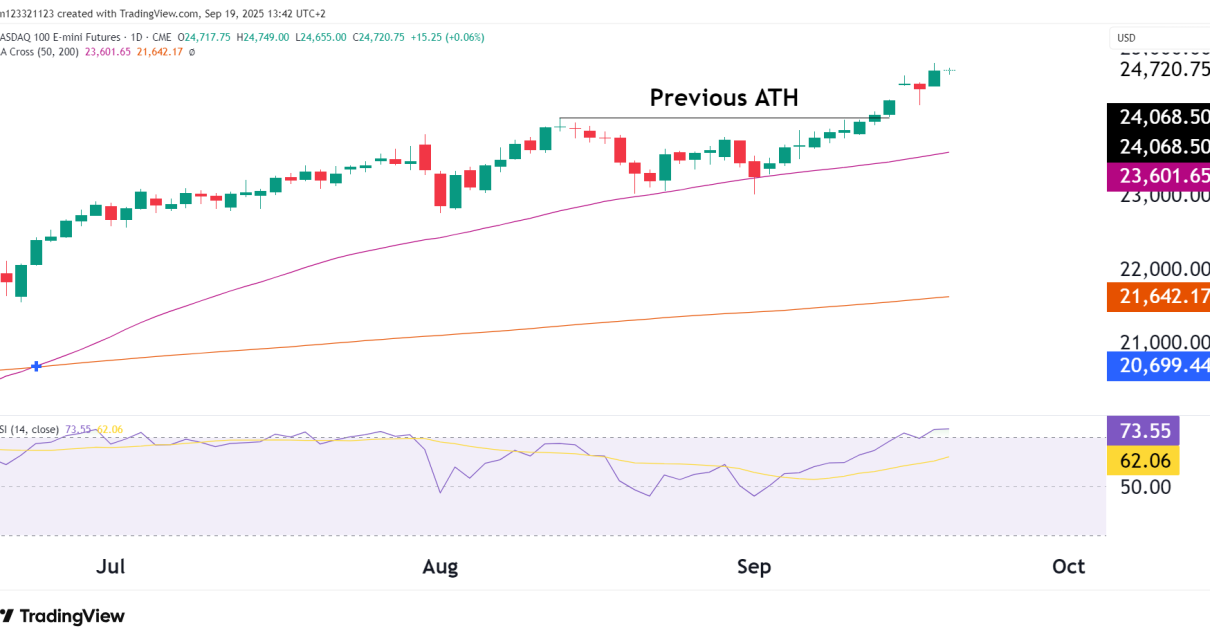
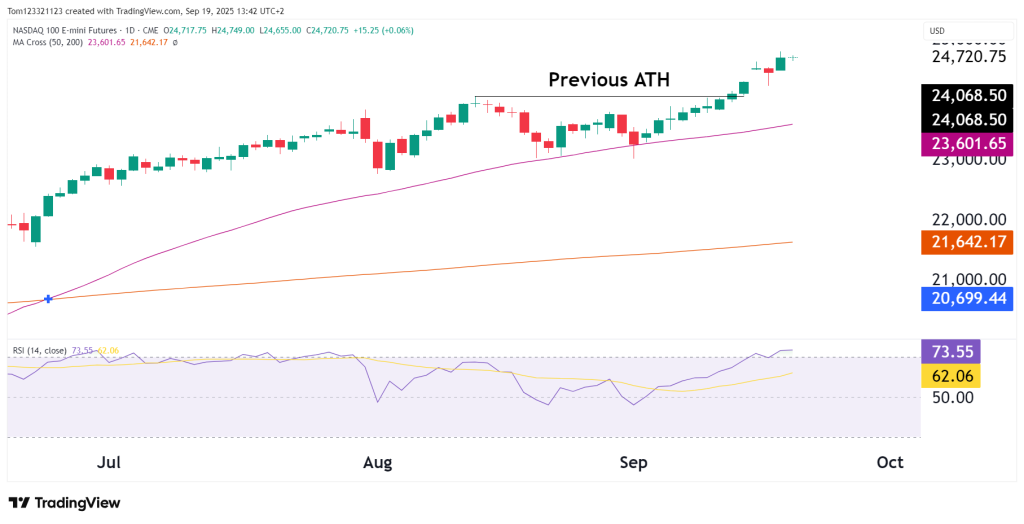
The Nasdaq 100 (NQ) has powered into new all-time highs (ATH), breaking above the 24,068 resistance and climbing to 24,720. The move confirms continued bullish strength in tech, but momentum is stretched, leaving the index vulnerable to a short-term cooldown.
Technical Update
- Breakout:
NQ has successfully cleared its previous ATH at 24,068, flipping it into support. This confirms a bullish breakout structure. - Trend:
Price remains well above both the 50-day MA (23,602) and the 200-day MA (21,642), with a golden cross firmly in play since June. The rising moving averages reinforce the bullish macro trend. - Momentum:
RSI sits at 73.55, firmly in overbought territory. Similar to prior rallies, this suggests the risk of a pullback or consolidation in the short run before continuation higher. - Candlestick Behavior:
Recent candles show smaller real bodies after strong upward thrusts, hinting at early signs of momentum exhaustion.
Key Levels
| Level | Type | Note |
|---|---|---|
| 24,720 | Resistance | Current high, extension point |
| 24,068 | Support | Previous ATH, now key support |
| 23,602 | Support | 50-day MA, trend support |
| 21,642 | Support | 200-day MA, long-term floor |
Outlook
- Bull Case:
Holding above 24,068 keeps bulls in control. If momentum persists, NQ could extend toward 25,000, a psychological resistance zone. - Bear Case:
With RSI overheated, profit-taking could drag NQ back toward 24,068. A deeper correction would target the 50-day MA near 23,600. Only a break below this area would challenge the medium-term uptrend.
Final Takeaway
NQ is in full breakout mode, with a clean push into unseen highs. The long-term trend remains bullish, supported by strong moving averages. However, with RSI overbought, the odds of a short-term pullback have risen. Dips into 24,068–23,600 should be viewed as potential buy-the-dip zones within the broader uptrend.
