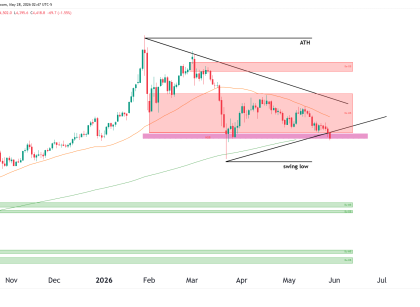
Fundamental Analysis

Equities Rally as S&P 500 Hits Another Record High

On Monday, equities rallied as the S&P 500 set another record high, driven by gains in tech stocks. Meanwhile, investors awaited corporate reports for insights into this year’s profit outlook. Additionally, on Friday, the S&P 500 confirmed its bull market status since its low on October 12.  Top tech companies like Microsoft and Apple will Read More…

E-mini S&P 500 (ES) futures
Technical Analysis

Bulls in full control as S&P 500 (ES) Surges

Weekly Chart Analysis: The price of ES has made a significant move by closing above the all-time high (ATH), which suggests a strong bullish bias. We see a clear break above the previous resistance level, which bulls want to see serve as support in any potential retest. If you’re looking for a bullish confirmation of Read More…

Trading Tips

Relative Strength Index (RSI) Indicator Explained

Introduction As a trader, having the right indicators in your toolbox can mean the difference between successful trades and costly mistakes. One of the most powerful and versatile tools available is the relative strength index (RSI indicator). Virtually every trader knows about the RSI, but are you using it to its full potential? In this Read More…

Fundamental Analysis

Equities Dip as December Retail Sales Exceed Forecasts

On Wednesday, Wall Street equities closed lower as December US retail sales data beat expectations. These sales figures dampened hopes for an early start to the Fed’s rate-cut campaign in March.  The optimistic sales report on Wednesday prompted economists to revise upward their growth estimates for the fourth quarter. Moreover, the report comes after solid Read More…

Technical Analysis

Gold futures (GC) MACD bearish, but POC bullish

Weekly Chart The weekly chart shows how significant the false break has been in GC with bulls still unable to push through. The recent ‘Failed Attempt’ to break above this level is beginning to show signs of exhaustion from the bulls. Immediate support is seen at the rising trendline, currently near the 1974.4 mark. A Read More…

Technical Analysis

Euro FX futures (6E) technical analysis trades both directions

Weekly Chart Analysis: The weekly chart exhibits a consolidation pattern with a clear ‘Point of Control’ at approximately 1.09220. This level represents the price with the highest volume traded over the analyzed period and acts as a significant area of balance between supply and demand. The presence of a ‘Low Volume Node’ below this range Read More…