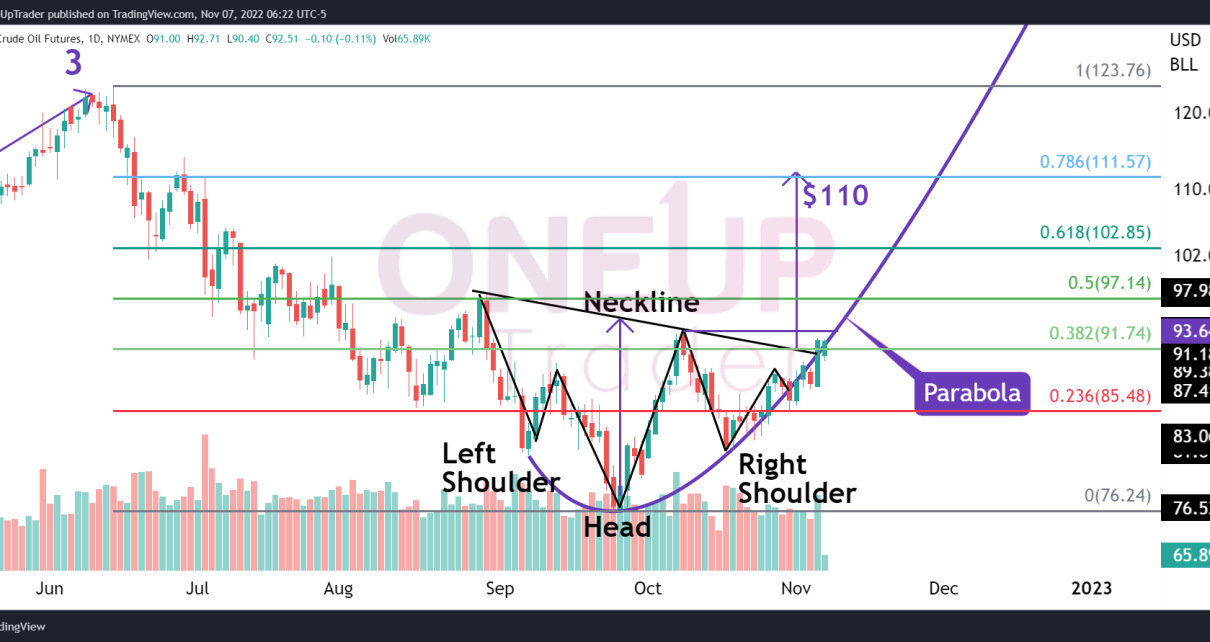
Major Support Zone Proving to be strong on the Daily chart Downtrend Channel on the 2-hourly chart Potential 1-2-3 Reversal pattern on Daily Chart What Has Happened? Since August 31, we expected some strong support around the $1,715.3 level; we have seen that play out now with bids coming in the past week as the Read More…
Tag: Future Trading Tips
E-mini S&P 500 (ES) Futures: Investors Shifting Focus to Stable Sectors
Rising interest rates could lead to economic hardship. Investors are favoring stable sectors like healthcare in a downtrend market. Investors expect a wave of rate hikes this week. E-mini S&P 500 (ES) futures remain under intense selling pressure as the US dollar soars following an upbeat jobs report. Some investors are choosing to place their Read More…
Technical Outlook: Crude Oil Futures (CL) Consolidates
Potential short-term bullish reversal on CL Short Trade running out of steam Bullish divergence forms on MACD Bulls vs Bears On the 4-Hour chart, we clearly see a consolidation zone forming on the CL chart between $87 and $95. This is happening after a two-month downtrend. The swing indicator is showing lower lows are being Read More…
Exponential Moving Average: What is the EMA Indicator?
Moving averages (MAs) are among the most popular technical trading indicators. Their popularity majorly stems from their simplicity and versatility – they are easy to calculate and use; can be used to show both a price action’s trend and strength. Thanks to their popularity, several variations of the moving average exist. This guide will discuss Read More…
E-mini S&P (ES) 500 Futures: US Inflation Uncertainties and Poor Earnings Weighing
Micron, Novavax, and Upstart warn investors of poor future earnings. Investors are waiting to see if US inflation has peaked. Rising bond yields cause the decline of growth stocks pushing stock futures lower. Micron, Novavax, and Upstart have warned investors that future earnings and revenue will be lower than anticipated. The S&P 500 dropped by Read More…
Bear and Bull Flag Pattern Trading
Continuation chart patterns occur in a trending market and typically indicate a momentary period of price consolidation before the market continues trending in the previously observed trend. This guide focuses on one such chart pattern – the flag chart pattern. We’ll break down the bear and bull flag pattern trading. What is the Flag Chart Read More…


