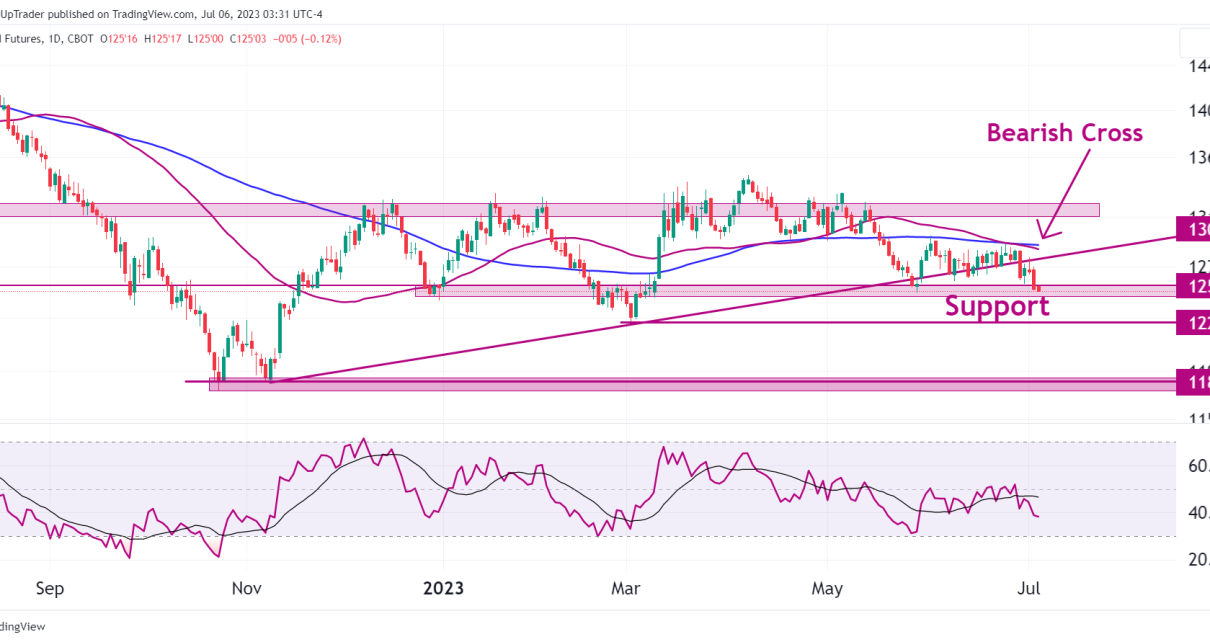
Market Overview Technical Analysis

Technical Outlook: Channel Analysis for Russell 2000 (RTY) Futures

Trend channel identified on the 4-hourly chart. Analysis of the order block on the 15-minute chart. Trend Channel Analysis Looking at the 4-hourly chart, there is a strong bullish channel that we can take note of. Currently, the price of RTY is trading around the low of the channel, and it may be ideal to Read More…

Market Overview Technical Analysis

1-2-3 Reversal Pattern Back On The Cards For Crude Oil (CL) Futures

The long-term 1-2-3 reversal targets are back on the cards Short opportunities on the 30-minute chart. The 1-2-3 Reversal Pattern We must go back to September to view our analysis of the 1-2-3 reversal. Since the market has now broken below recent lows, the bearish target is in play. You can view that article here. Read More…

Equities covid
Fundamental Analysis

Equities Fall as Risk Sentiment Suffers Due to Protests in China

Investors worry over ongoing protests in China. PBOC will release about $70 billion to boost the Chinese economy. There is growing resentment of the Zero-COVID policy in China. The Equities market fell on Monday as concerns over the control of the virus in the second-largest economy in the world increased following unusual protests against the Read More…

Precious metal
Fundamental Analysis

Precious Metals Tick Higher as the US Dollar Continues to Weaken

Precious metals continue to rally after FOMC minutes. Long-term US Treasury yields fall to a more than seven-week low. Investors are leaning towards a 50bps Fed hike in December. The prices of precious metals rose on Friday as markets continued to assess the Federal Reserve’s dovish signals. Long-term Treasury yields in the United States fell Read More…

6E euro dollar after donald trump victory
Market Overview Technical Analysis

Technical Analysis: A New Look At The Euro (6E) Futures

Multi-Year Resistance zone spotted on the weekly chart. Forward-looking potential bullish targets. Ascending Triangle pattern found on the hourly chart. Multi-Year Resistance at 1.0471 Zooming out on the daily chart for Euro, we can see that the price is currently trading within a multi-year resistance zone at 1.0471. In 2015 – 2017, a triple bottom Read More…

gold technical analysis futures oneup trader funded trader program
Market Overview Technical Analysis

Gold (GC) Futures Retrace & Find Support Off Point of Control

Technicals appear bullish in the medium term for Gold. Analysis of the volume profile, Fibonacci retracements, and 100-day Moving Average. Entry and stop loss placement ideas. Daily Chart Analysis In our previous article, we indicated that even though Gold was rallying with strong intent, there was no point chasing the market, but rather ideal to Read More…