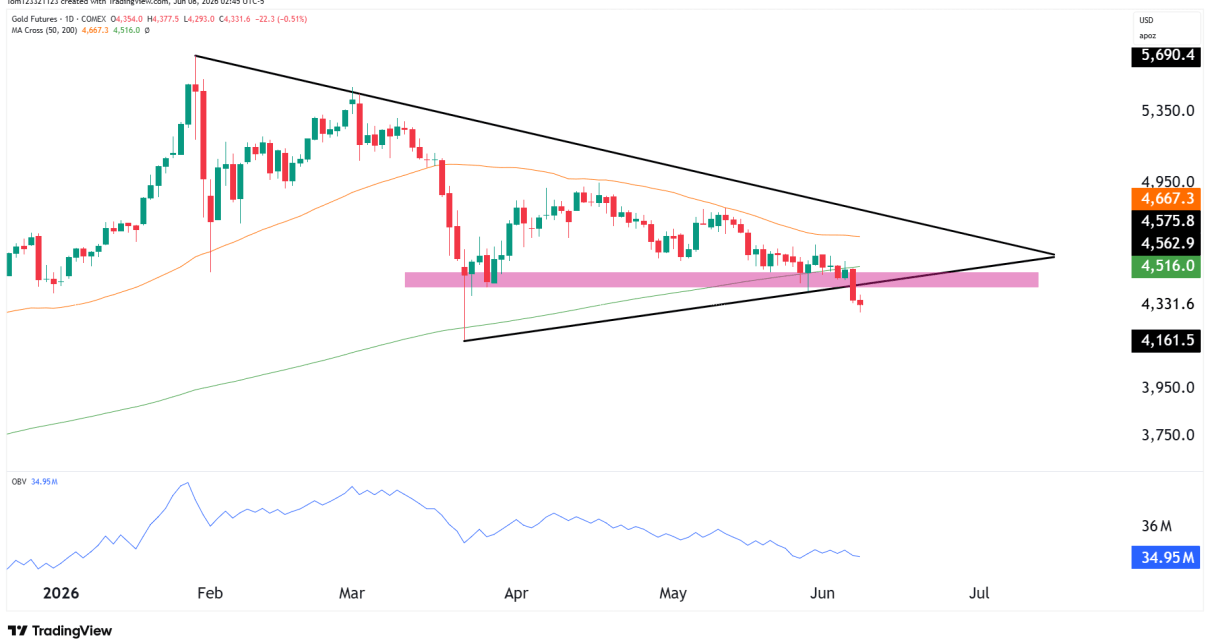
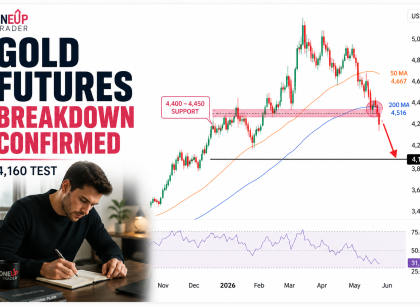
S&P 500 futures
Technical Analysis

Technicals get out of hand in S&P 500 futures (ES)

Weekly Chart Observations: ES has been getting out of hand lately and just continues to rally no matter what. The Alligator indicator has the Lips (4821.50), Teeth (4733.71), and Jaw (4631.17) fanning out, which confirms the trend strength. Taking shorts now is highly risky and the only thing that could stop this market from going Read More…

Crude Oil Futures
Fundamental Analysis

Oil Prices Climb Amid Escalating Middle East Tensions

Oil prices rose on Wednesday due to rising tensions in the Middle East that could lead to tighter supply. At the same time, a surprise drop in gasoline stocks indicated an increase in demand.  Aggregate open interest in crude (Source: ICE, CME) Investors are buying more oil futures, expecting tighter supply and higher prices. Israel Read More…

Fundamental Analysis

Gold Bounces Back, Pausing the Jobs Report Dip

Gold prices rose on Tuesday, pausing a decline that started on Friday after the US jobs report. The recovery came as the dollar and Treasury yields pulled back from recent highs. However, this decline might be short-lived if fundamentals continue pointing to delayed rate cuts in the US. Fed rate cut expectations (Source: Bloomberg) Notably, Read More…

Crude Oil Futures
Technical Analysis

Crude Oil futures gear up for bullish breakout

Weekly Chart: The price action is hovering above an established multi-year support zone that is the main point for the bull’s case. The Alligator indicator shows the Jaw, Teeth, and Lips converging, signaling a potential consolidation phase. However, with the price maintaining levels above the Alligator’s Lips, we maintain a bullish outlook. The RSI is Read More…

world stocks recovery
Fundamental Analysis

Currency Futures Lose Ground After Blockbuster US Jobs Report

Friday was a down day for currency futures as the dollar rallied to a seven-week high after upbeat employment data. Investors were surprised after the US non-farm payroll figures were much higher than expected. As a result, there is an even lower chance that the Fed will start cutting rates in March. US jobs (Source: Read More…

Technical Analysis

Bulls target $2,600 in gold futures (GC)

Weekly Chart Analysis:The weekly chart shows a consolidation below the previous all-time high (ATH) with most dips generally being bought back up. The resistance level to watch is the previous ATH at $2089.0. A decisive weekly close above this level could signal a bullish continuation, potentially targeting the bull target zone around $2400.0. However, should Read More…