Featured Snippet: What Are Trend Lines in Trading?
Trend lines are lines drawn on a price chart to show the direction of a market. They connect key highs or lows and act as support or resistance levels. Traders use trend lines to identify trends, spot entry points, and anticipate potential reversals or breakouts. More importantly, they provide a simple visual framework that helps remove guesswork and keeps your decision-making grounded in structure rather than emotion.
How Do You Use Trend Lines?
• Draw a line connecting at least two clear swing highs or lows
• Wait for price to react at the trend line instead of predicting
• Trade bounces for continuation or breakouts for reversals
• Always wait for confirmation before entering a trade
Introduction
Trend lines are one of the most widely used tools in technical analysis, and for good reason. They are simple to draw, easy to understand, and effective across almost all markets and timeframes.
At their core, trend lines help you answer a very basic but important question: which direction is the market actually moving? Once that becomes clear, everything else like entries, exits, and risk management becomes easier to structure.
In this guide, you’ll learn how to draw trend lines correctly, how to trade them, and how to avoid the common mistakes that trip up most traders early on.
What Is a Trend?
A trend is simply the general direction in which a market is moving over time. While that sounds straightforward, many traders struggle with identifying trends consistently because they focus too much on small movements instead of overall structure. They also look at a chart and see that price is moving upward so they say its in an uptrend, this even though it sounds simple, leaves too much room for interpretation. Trend lines force a trader to find the swings lows/highs of a market and get them to connect with trend lines defining the trend far better.
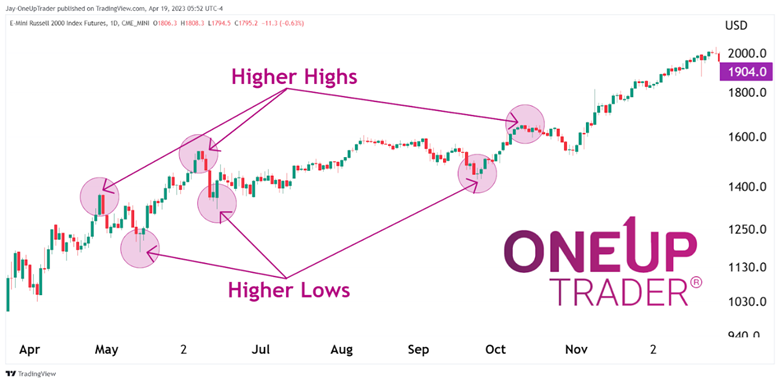
We can identify an uptrend when price forms higher highs and higher lows. This shows that buyers are in control and are willing to step in at higher prices over time.
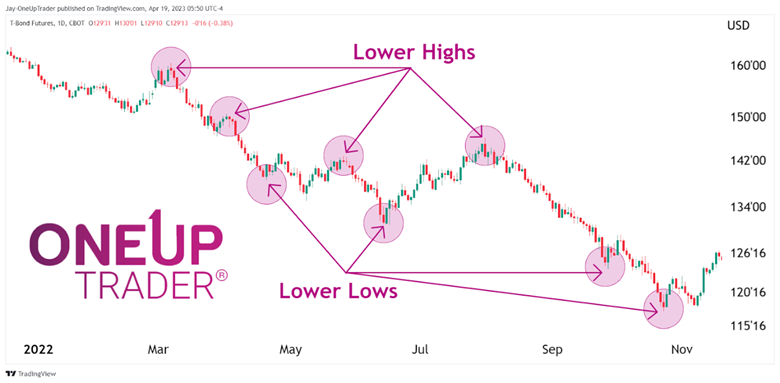
A downtrend is the opposite, where price forms lower highs and lower lows, indicating sustained selling pressure.
Types of Trends
• Uptrends
• Downtrends
• Sideways/Horizontal Trends (Consolidation)
An uptrend is a series of higher highs and higher lows. Each new push upward breaks previous highs, and each pullback holds above the previous low. This structure tells us that demand is consistently outweighing supply.
A downtrend is a series of lower highs and lower lows. Here, sellers are dominant, and price struggles to move higher without being pushed back down.
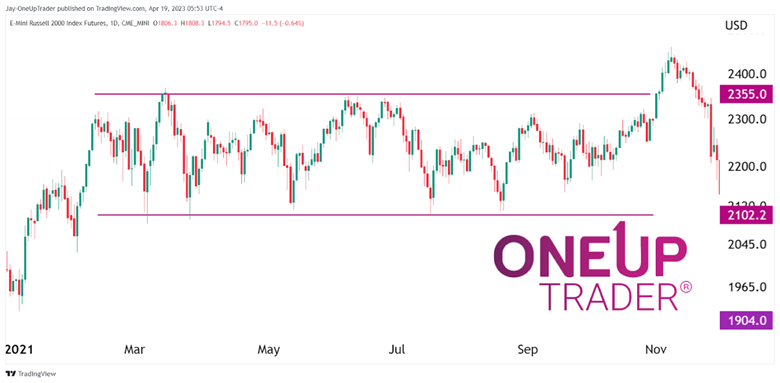
A sideways trend is when price moves within a range without a clear direction. While it may look like random movement, this phase often represents accumulation or distribution before the next strong move.
Trend Classifications
• Long-term trend
• Intermediate trend
• Short-term trend
A long-term trend is made up of multiple intermediate trends that unfold over time. These larger trends reflect the broader market direction and are often driven by major factors such as economic conditions or long-term sentiment.
Intermediate trends are smaller moves that occur within the long-term trend. They often move against the main direction temporarily, creating pullbacks or corrections that can offer trading opportunities.
Short-term trends are the smallest movements and are often influenced by immediate price reactions and short bursts of momentum.
Choosing the Right Timeframe
The timeframe you choose directly affects how you interpret trends. Weekly charts or long-term daily charts help you identify the bigger picture, while lower timeframes help refine entries.
The key idea is that the longer the trend, the more significant it is. A five-year trend carries much more weight than a short-term fluctuation, so it’s always important to understand where you are within the larger structure.
What Is a Trend Line?
A trend line is a simple but powerful tool used to visualize the direction of a market. It is drawn as a straight line connecting key points on a chart, typically swing highs or swing lows.
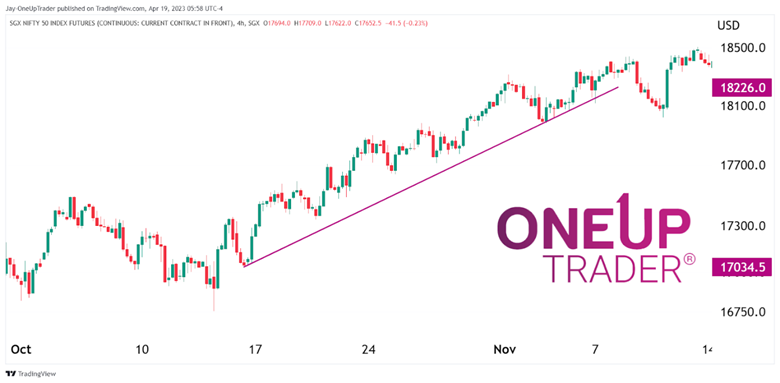
In an uptrend, we draw a trend line by connecting the lows. This line acts as a dynamic support level, showing where buyers have consistently entered the market. Each time price returns to this area, we pay attention to how it reacts.
If price respects the trend line and moves higher, it reinforces the strength of the trend. If it breaks, it may signal a shift in market behavior.
We can also draw a second line connecting the highs, forming a channel. This helps us identify where selling pressure may come in and gives us a clearer structure to work with.
How to Trade Trend Lines
Trading trend lines is about reacting to price behavior rather than predicting it. The goal is to use the structure they provide to make more informed decisions.
1. Trend Line Breakout Strategy
A trend line breakout occurs when price moves beyond a well-established trend line. This can signal a potential change in direction, but not every breakout is meaningful.
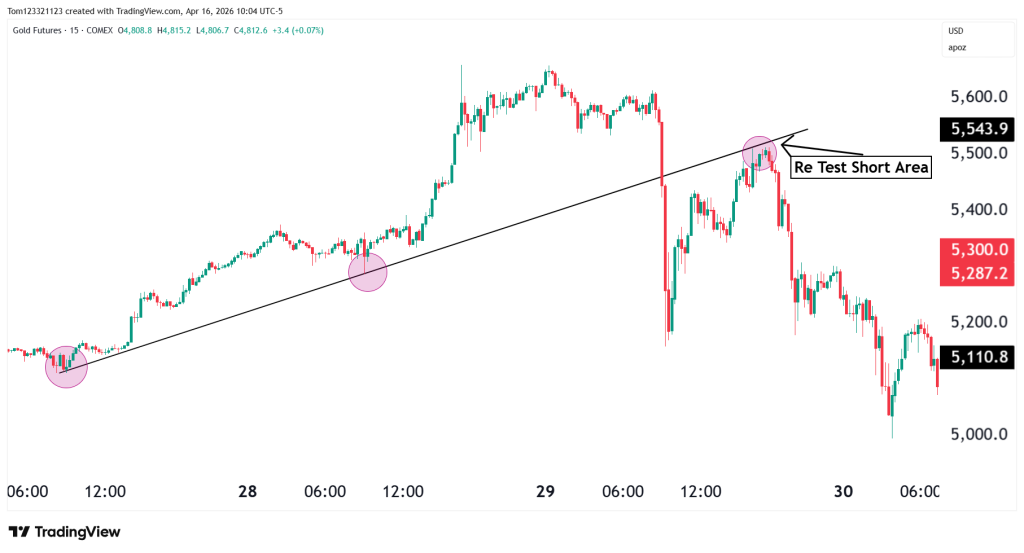
In an uptrend, if price breaks below the trend line, we can look for short opportunities. However, instead of entering immediately, it’s often better to wait for confirmation such as a strong close or a retest of the broken level.
Stop losses are typically placed just beyond the structure, while targets can be based on previous support or a defined risk-reward ratio.
2. Trend Line Bounce Strategy
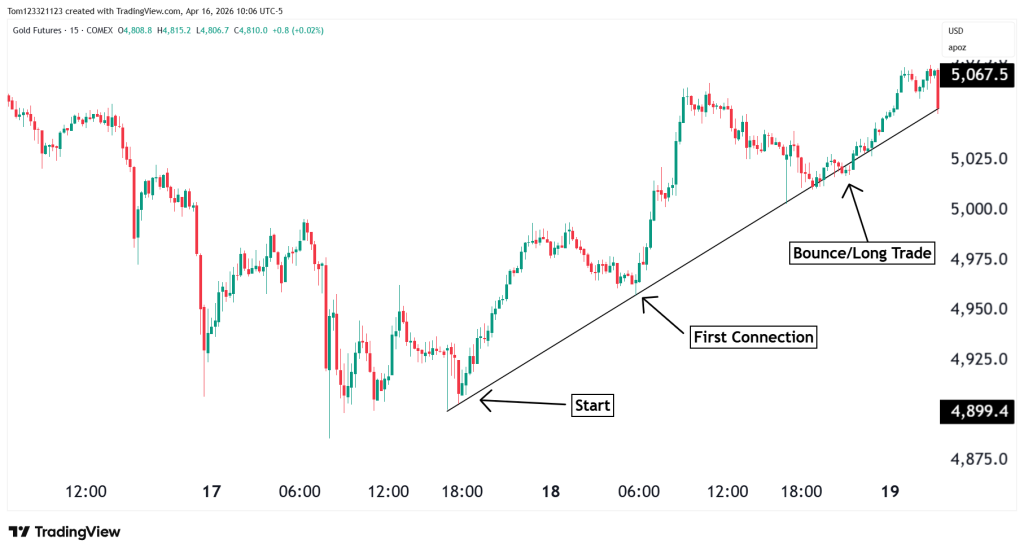
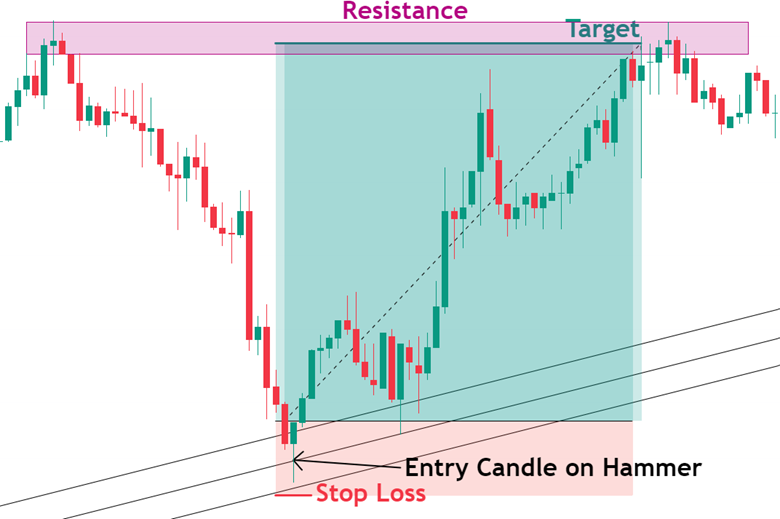
A bounce setup occurs when price returns to the trend line and respects it. This is often one of the cleaner ways to trade because you are entering in the direction of the existing trend.
Instead of guessing, we wait for confirmation. This could be a candlestick pattern or a clear rejection from the level.
Stop losses are placed beyond the recent swing point, giving the trade room to breathe while still managing risk.
Using Trend Line Zones
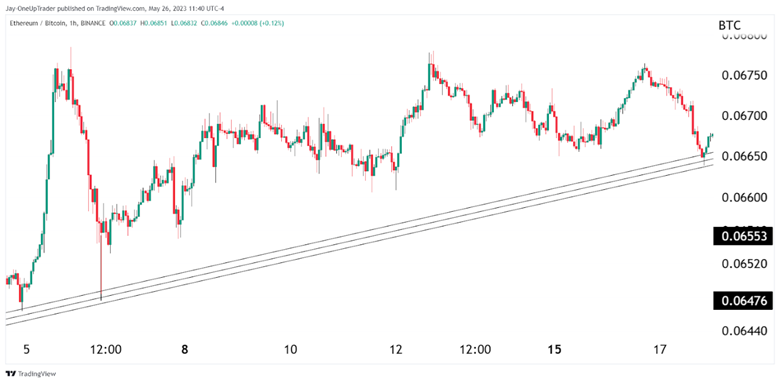
Rather than relying on a single precise line, it can be more practical to think in terms of zones. Markets are not perfectly precise, and price often overshoots or undershoots levels slightly.
By drawing multiple trend lines or adjusting for best fit, we create an area where price is likely to react. This approach reduces frustration and leads to more realistic expectations.
Common Mistakes When Drawing Trend Lines
One of the most common mistakes is forcing a trend line to fit the price. If the line doesn’t connect clean and obvious swing points, it’s likely not valid. Good trend lines should feel natural, not forced. Also, you can connect the trend lines to the wicks or the close/open of a candle.
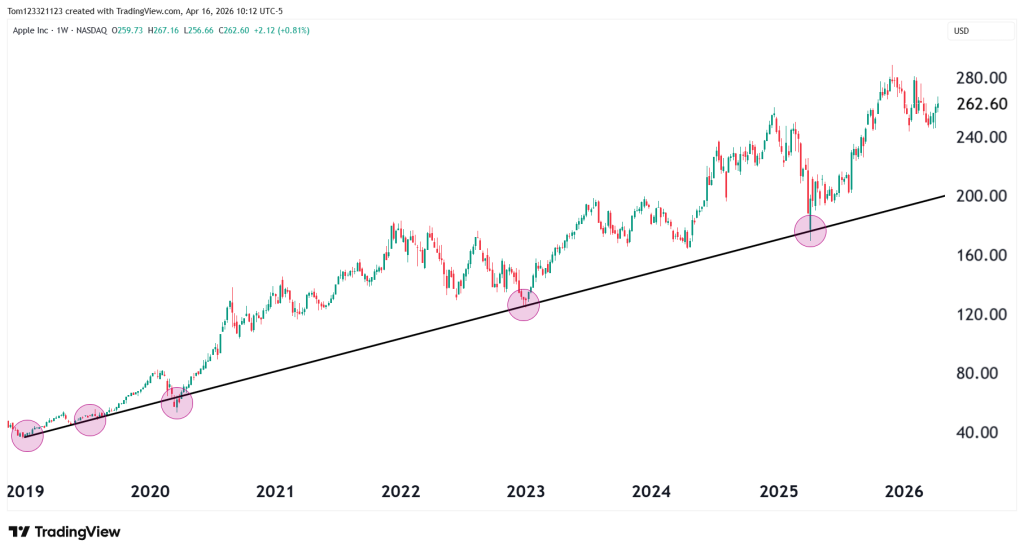
Another mistake is relying on only two touches. While technically enough to draw a line, it becomes far more reliable with three or more confirmations. This works the longer the trend is in place for, for example, a monthly chart going back years could respect a trend line for a long time giving a very reliable entry for investors.
How to Validate a Strong Trend Line
Not all trend lines carry the same level of importance. Some are weak and easily broken, while others are respected multiple times.
A strong trend line usually has multiple clean touches, consistent spacing, and clear reactions from price. These reactions show that market participants are paying attention to that level.
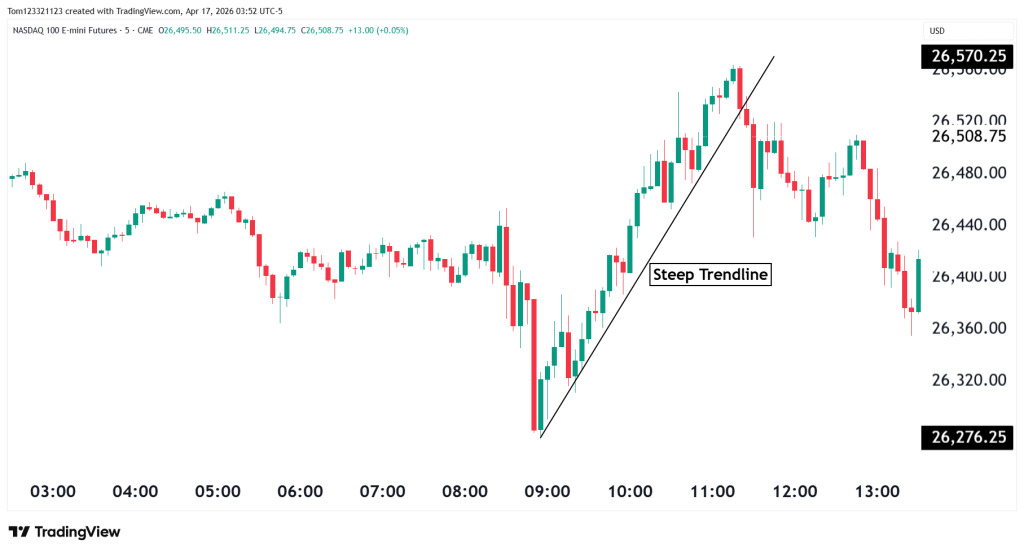
The angle of the trend line also plays a role. Extremely steep lines often break because they represent unsustainable momentum. More gradual lines tend to hold longer and offer more reliable setups.
Volume can provide additional context. Strong reactions with increased volume suggest stronger participation at that level.
Trend Line Breakouts vs False Breakouts
One of the biggest challenges traders face is distinguishing between real breakouts and false ones.
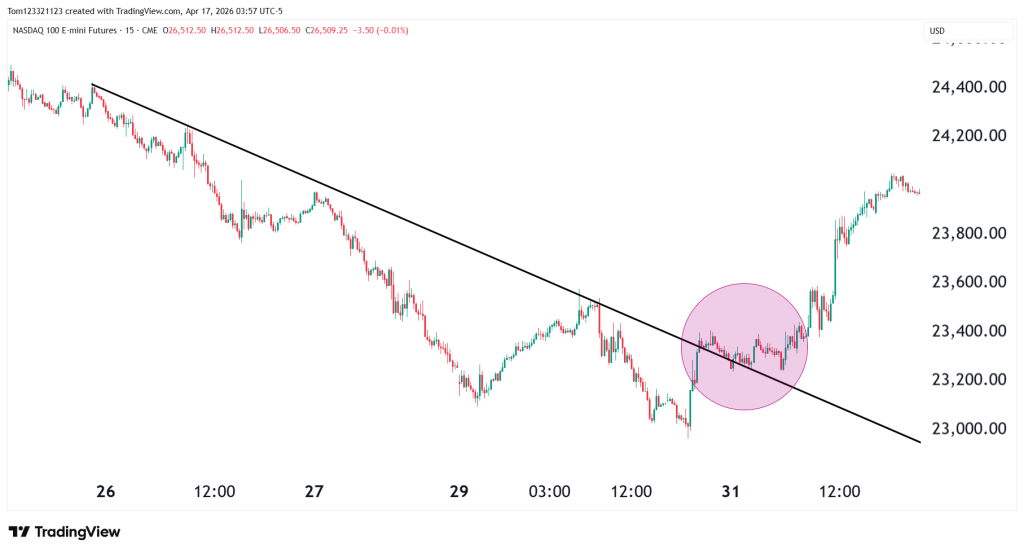
A true breakout usually shows strong momentum and a decisive close beyond the trend line. In many cases, price will return to retest the level before continuing, giving a second chance to enter.
A false breakout happens when price briefly moves beyond the trend line but quickly reverses. This often traps traders who enter too early without confirmation.
The key is patience. Waiting for confirmation and structure can help filter out low-quality setups.
Combining Trend Lines with Other Tools
Trend lines are most effective when used alongside other tools rather than in isolation.
For example, if a trend line aligns with a key support or resistance level, the area becomes more significant. Adding moving averages or Fibonacci levels can further strengthen the setup.
The idea is to look for confluence. When multiple factors point to the same area, the probability of a meaningful reaction increases.
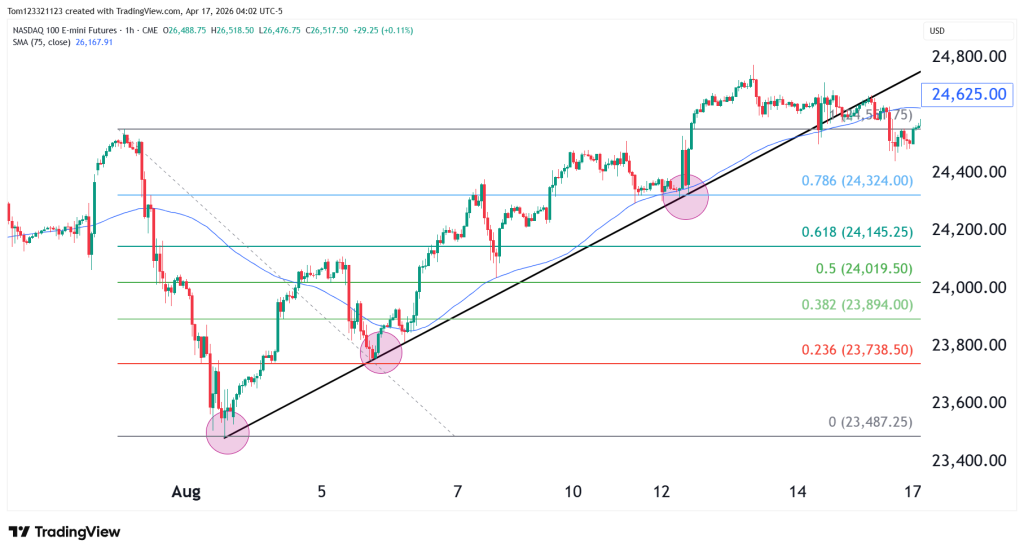
In the chart above, there are two clear connections for the trend line, and on the third point (third purple circle), there is a bounce off the moving average, and the price coincided with the 78% Fib level. This is a high probability entry with a high risk reward ratio, too, and a strong placement for the stop loss.
When Not to Use Trend Lines
Trend lines are not always the right tool for the job. In choppy or sideways markets, they can produce misleading signals because price lacks clear direction.
In these conditions, horizontal levels often provide better structure. It’s also important to be cautious during periods of high volatility, such as major news events, where price can behave unpredictably.
Recognizing when not to use a tool is just as important as knowing how to use it.
Key Takeaways
When learning how to use trend lines, focus on three core ideas:
• Draw clean, obvious trend lines based on real structure
• Wait for confirmation instead of anticipating moves
• Trade in the direction of the broader trend whenever possible
Frequently Asked Questions (FAQ)
What is a trend line in trading?
A trend line is a line drawn on a chart that connects key highs or lows to show market direction. It helps traders identify trends and potential entry points.
How do you draw a trend line correctly?
Connect at least two clear swing points, but look for three or more touches to confirm strength. The cleaner the connection, the more reliable the line.
Are trend lines reliable?
They can be very reliable in trending markets, especially when combined with other tools and used with proper confirmation.
What is a trend line breakout?
A breakout occurs when price moves beyond a trend line, potentially signaling a shift in direction.
What is a false breakout?
A false breakout is when price briefly breaks a trend line but quickly reverses, often trapping traders.
Can you use trend lines on any timeframe?
Yes, but higher timeframe trend lines tend to carry more weight and reliability.
Final Thoughts
Trend lines are simple, but that simplicity is what makes them powerful. They provide structure, clarity, and a consistent way to read the market.
The real edge comes from how you use them. Not just drawing lines, but understanding what they represent and how price behaves around them.
Keep your approach clean, stay patient, and focus on quality setups. Over time, you’ll develop the ability to read trend lines naturally and use them as a core part of your trading strategy.