Introduction
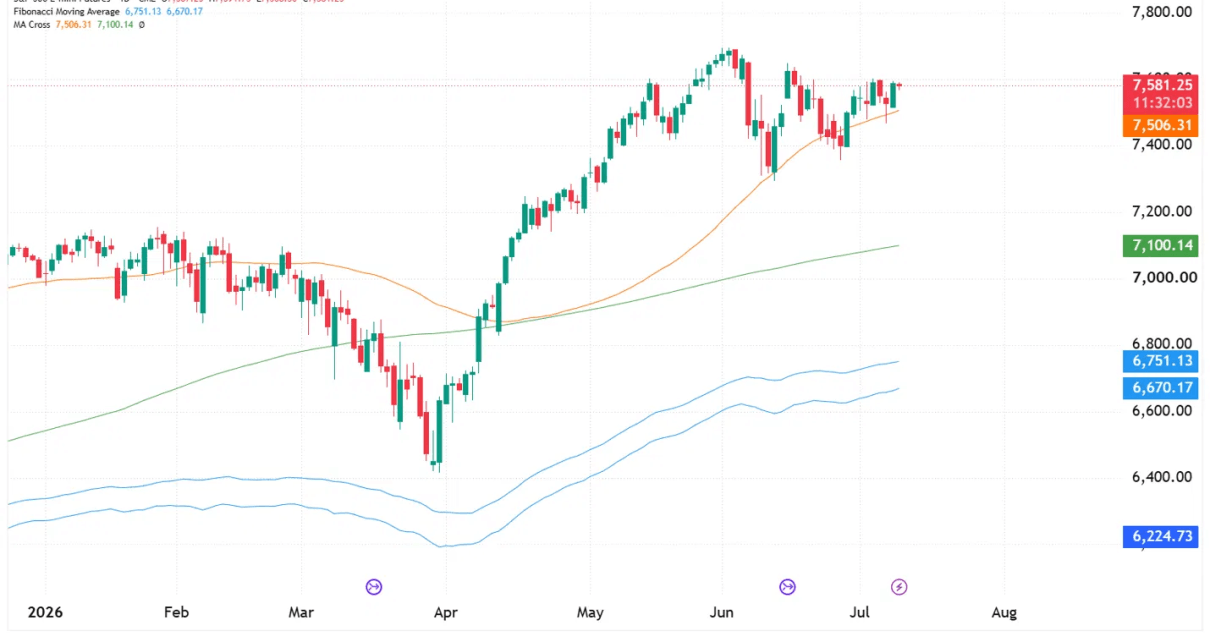
S&P 500 futures are retesting the underside of their June swing high after reclaiming the 50-day moving average on the pullback. Price is currently at 7,581.25, just below the 7,650 area that capped the rally in early June. It is an important zone now, there are some flags forming on lower time frames, so we could see a big bullish breakout. On the flip side, a fail here could mean we see prices fall sharply next week.
S&P 500 Futures Trend Analysis
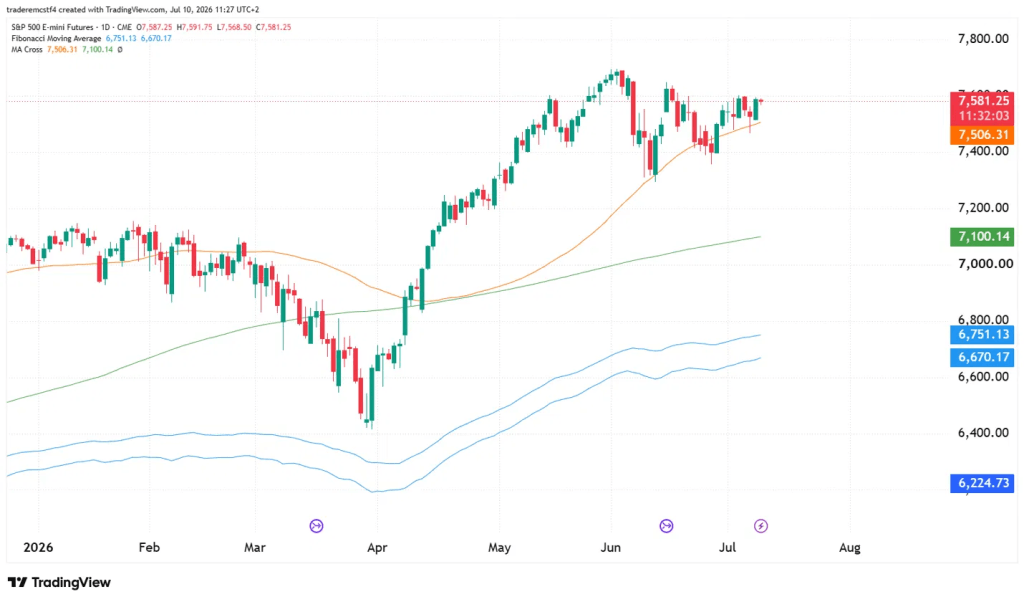
ES fell from around 7,300 to 6,300 between February and April, then reversed sharply, rallying into a swing high near 7,650 by early June. Since then, price has ranged between 7,400 and 7,590, pulling back into the rising 50-day MA (7,506.31) before bouncing back up to retest the top of that range.
A retest of an unconfirmed high has a different risk profile than a breakout to new highs. First attempts at a prior high fail more often than they succeed, since the supply that capped price the first time is often still there. A second test built on higher lows underneath tends to have better odds of clearing the level than a first attempt. Right now this looks like the second real test of the 7,581–7,650 zone.
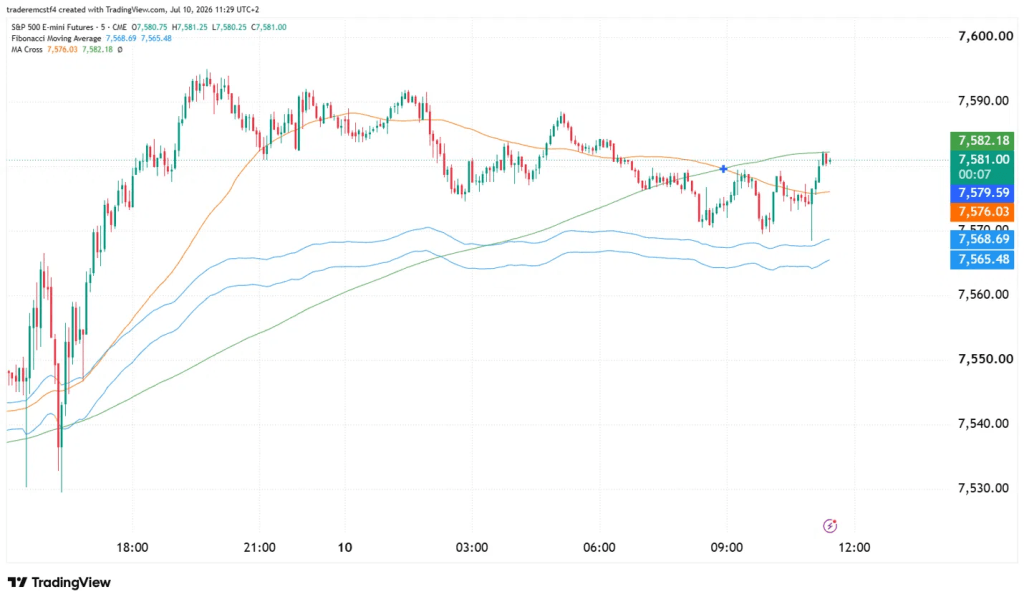
Intraday context (5-min chart): Overnight price chopped between roughly 7,565 and 7,595. A short-term MA cross flipped bullish around 09:00 UTC+2, just before price pushed to the session high. That cross offers a tighter, faster entry signal than waiting on a full daily close, for anyone trading this intraday.
Key Levels
| Level | Notes |
|---|---|
| 7,650 | June swing high — a clean daily close above this, not just a wick, would confirm continuation |
| 7,581 – 7,590 | Current price / recent session highs, the immediate level to clear |
| 7,506 | Rising 50-day MA, has already held as support once on this leg |
| 7,400 | Bottom of the month-long range |
| 7,100 | 200-day MA, still rising, confirms the longer-term trend is intact |
Possible Trades
Scenario 1: Breakout continuation Highest-probability outcome if it plays out, but needs confirmation rather than being front-run. Acting before a close above 7,590 is where most retest failures happen.
- Entry: Daily close above 7,590, or an intraday bullish MA cross with price holding above it
- Stop: Below 7,506
- Target: 7,650, with further upside on a clean break
- Note: Reward-to-risk is lower here since it’s an entry near resistance rather than support
Scenario 2: Rejection and pullback to the 50-day MA Given this is only the second test of the June high, a stall here followed by a rotation back to the 50-day MA is a realistic outcome. This offers better risk/reward than chasing the breakout, since it’s an entry near proven support rather than unconfirmed resistance.
- Entry: Bullish reaction (rejection wick, reversal candle) near 7,506
- Stop: Below 7,400
- Target: 7,581–7,650
Scenario 3: Range breakdown Lowest-probability near-term outcome given the trend and the still-rising 200-day MA, but the one that would actually change the picture.
- Trigger: Daily close below both 7,506 and 7,400
- Implication: Would suggest the pullback has turned into something bigger than a normal correction within the uptrend
Summary
ES is testing the second attempt at its June high, with the 50-day MA holding as support underneath it on the recent pullback. The breakout scenario has the higher long-term probability given the trend, but the pullback-to-50MA setup offers better risk/reward if price stalls here again. A close below both 7,506 and 7,400 is the level combination that would change the broader bias.
This analysis is provided for educational and informational purposes only and should not be considered financial or trading advice. Trading futures, forex, and other leveraged financial instruments carries a high level of risk and may not be suitable for all investors. Past performance is not indicative of future results. Before making any trading decisions, conduct your own research, assess your risk tolerance, and consult with a qualified financial advisor if necessary.