- The yearly low support breached.
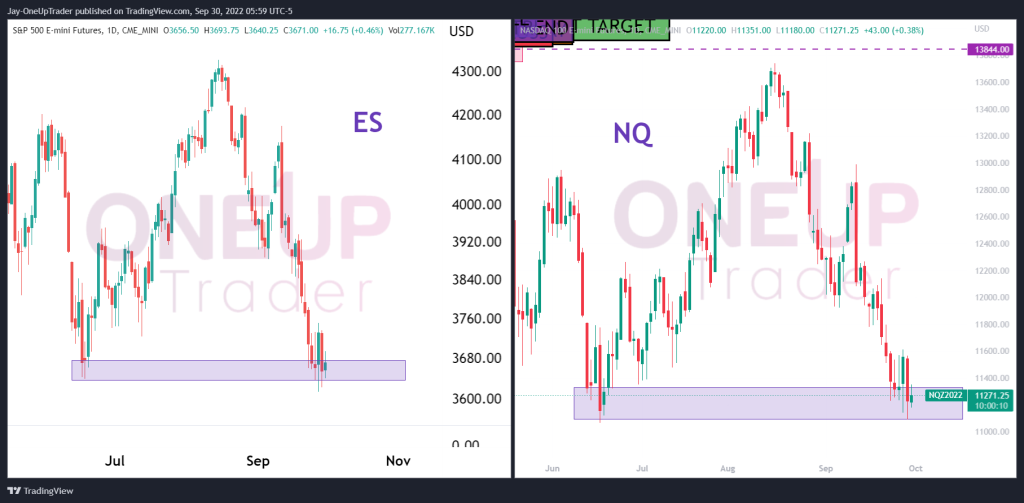
- What the correlation between the major indices tells us
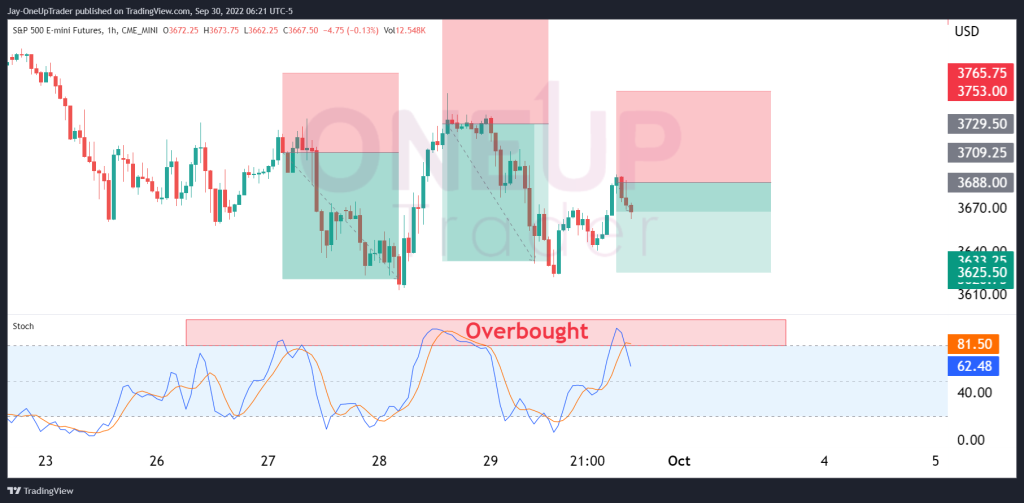
- Lackluster price action on the shorter time frames
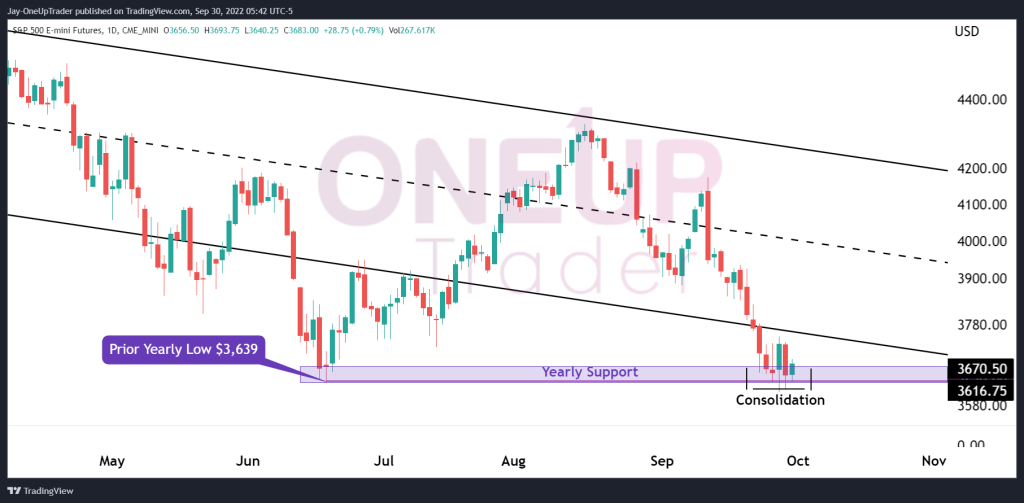
Yearly Support Breached
The E-mini S&P 500 (ES) traded at the yearly low of $3,639 for the first time since June; prices actually breached the low before moving back upward and have been settling in a sideways consolidation since Friday of last week. A sufficient amount of buying at these levels has held the price above the support zone, but the question is whether it’s strong enough to have a strong relief rally or will the level eventually be broken to the downside.
Correlation Between Indices And How It Can Help Us
We know the correlation between the indices results from large companies such as MSFT, APPL, etc. being included in the major indices. We see them move in very similar ways, but how can we use this information to better our trading decisions.
Look at the chart below, ES on the left, NQ on the right. The correlation is very high, so what would happen if NQ suddenly dropped below the support zone and ES remained above it? It can be looked at as an arbitrage opportunity. It would tell us that the NQ sell-off may not be as strong as initially thought since ES has not followed through. Alternatively, if we see both indices break out of the zone around the same time, it adds additional strength to the price drop.
Traders can take advantage of these situations by monitoring the other indices that are highly correlated to the one they are trading. If they notice one index is moving faster in a certain direction than the other, it could be a sign the move is over-extended.
A Look at Shorter Time Frames
Since the overall sentiment and trend is down, we don’t see why there should be longs being taken until we get confirmation from the Fed that they intend to slow down on the rate hikes. There is no need to fight the Fed, and so short positions, taken on the hourly chart when the stochastic indicator is overbought, could be a way to enter the market for traders who intend to scalp a few points.