


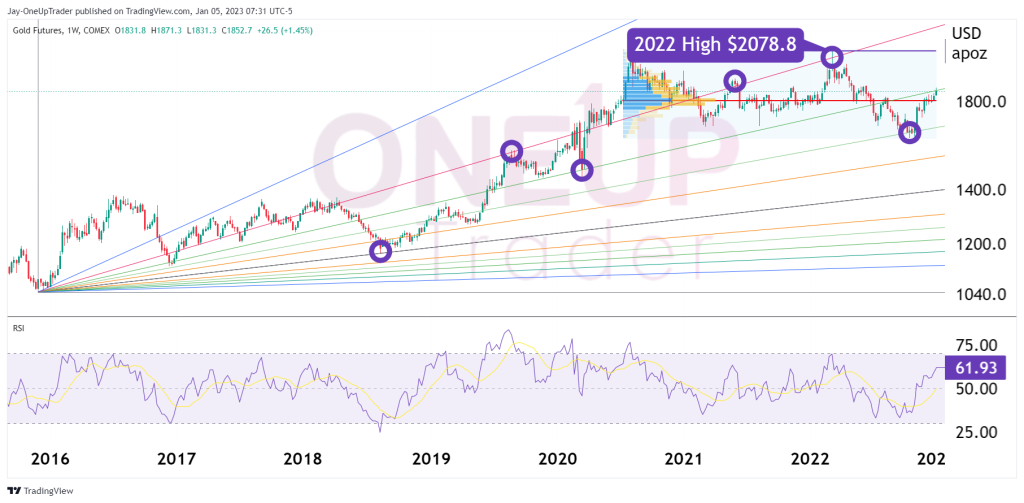
- Gold is now only 12% away from 2022 highs.
- Critical technical indicators that help us understand recent price action.
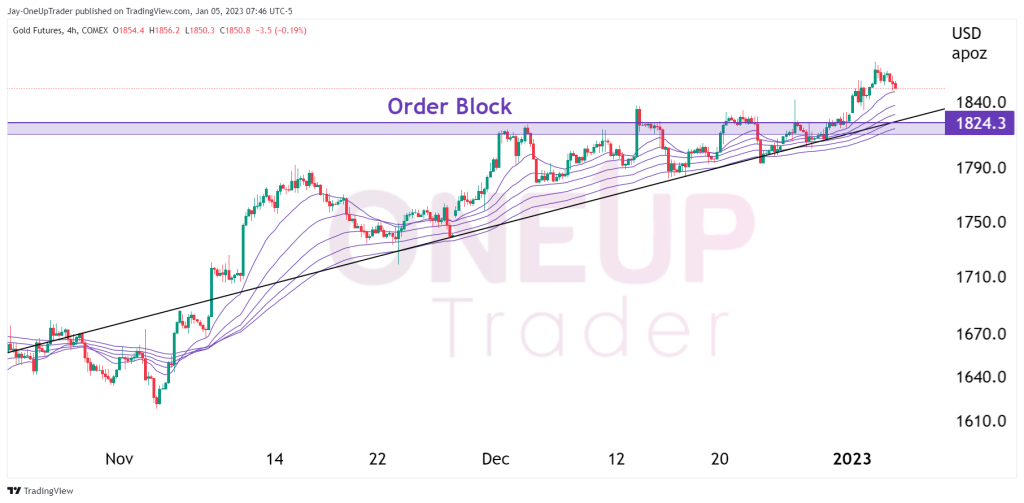
- Analyzing an Orderblock and Moving Average Band for Improved Entries.
Gold Up 2.6% So Far in 2023
It’s been a positive start for Gold, with the yellow metal up 2.6% in the first week of trading for the year. With the 2022 yearly high only 12% away from current market prices, bulls are looking for a rally to continue into the first quarter of this year. We can monitor a few technical indicators in the coming weeks to decipher whether GC is likely to continue rising.
Technical Indicators
- Fibonacci Fan – Uses horizontal lines to identify support and resistance zones in an instrument’s price action. It is constructed by drawing a trendline between two extreme price points, then drawing horizontal lines at the Fibonacci levels of 23.6%, 38.2%, 50%, 61.8%, and 100% of the vertical distance between the two points, thus creating the fan. Price has tested some of the Fib lines a few times and is currently hovering on the 023.6%. There may be some resistance at this level, so bulls looking to long GC might be better off holding out for a few days or even weeks.
- Relative Strength Index (RSI) – The RSI is trading at 61.93 after crossing the 50 line towards the end of November. There is still plenty of upside potential for this indicator. Only when we see prints of over 70 could it signal time to consider slowly unwinding long positions.
- Volume Profile – The Point of Control (POC) line in the Volume Profile indicator is a horizontal line that represents the price level at which the most volume has been traded within a specified time period. It is a key level because it reflects the price at which most trades were placed. The POC is currently at $1,800 for the past two years of trading data. With Gold trading above that ($1,848), it will likely act as support going forward.
Order Block & Moving Averages Analysis
There is an order block at $1,828.3. If we pair that with a moving average band, the market is looking slightly overbought at the moment. A retracement back into the order block and moving averages may be the best bet for bulls wanting to go long. We know how important it is to refrain from chasing the market. When we do, trades are taken based on emotions instead of from sound analysis and strategy. It is imperative to stick to a trading plan at all times.
Summary
Gold has had a positive start to the year, with prices up 2.6% in the first week of trading. While there is still potential for the metal to continue its rally, technical indicators such as the Fibonacci Fan and the Relative Strength Index (RSI) suggest that there may be some resistance at current levels. The Point of Control (POC) line in the Volume Profile indicator is currently at $1,800 and is acting as support for gold prices. An order block at $1,828.3 and a moving average band suggest that the market is slightly overbought, which may be a good opportunity for bulls to consider entering long positions. However, it is essential to have a sound trading plan and not make decisions based on emotions.
Earn a fully funded trading account with OneUp Trader here.
