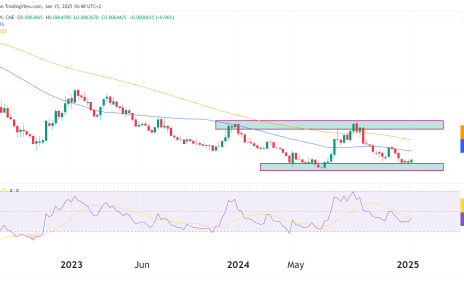
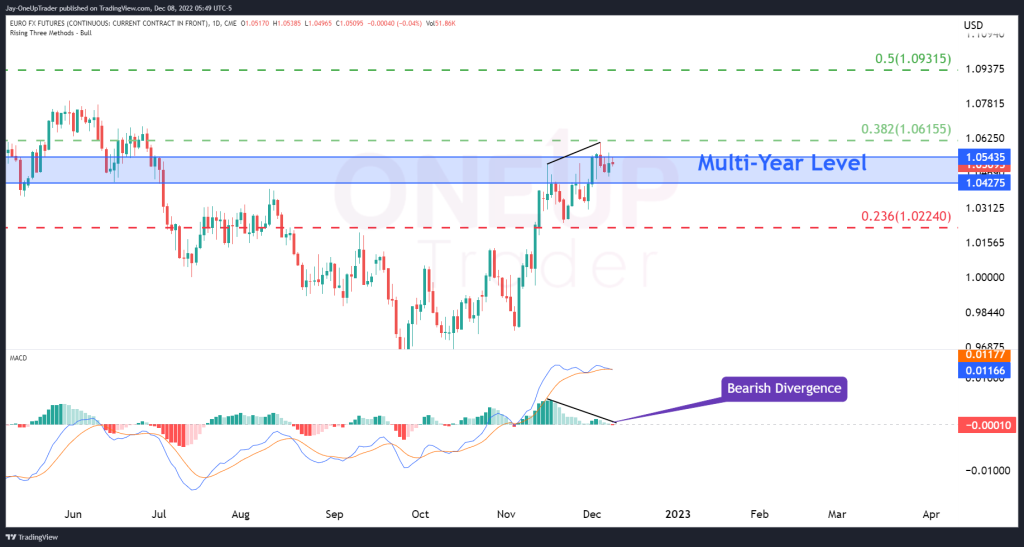
- 6E is still trading within the Multi-Year level we have been watching closely.
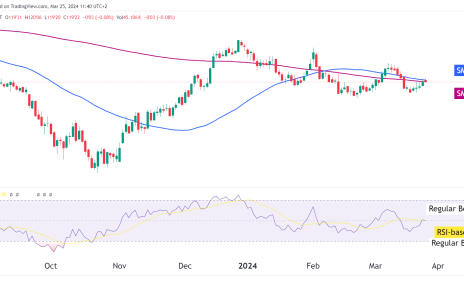
- MACD showing signs of bearish divergence.
- Morning star spotted on the monthly chart.
Technicals Showing Bearish Sentiment
Multi-Year Level
The multi-year level we have been watching closely still has a tight grip on the Euro. You will remember from last week’s analysis that we expected more selling pressure and indicated that 6E might struggle to push through the level, especially on its first attempt. We still see the price hovering inside the zone at the time of writing.
MACD Bearish Divergence
Applying the MACD to the daily chart shows a heavy bearish divergence at the moment. The moving averages also seem to have peaked, which signifies that consolidation in price could occur for some time. This means it’s probably not the best time to initiate new long positions. The divergence doesn’t mean that we will sell off; it just indicates that there is a higher-than-normal probability that the bullish momentum will be halted for a while.
Fibonacci 0.382 Level
The Fib 0.382 retracement was tested almost to the tick and is our most recent high in 6E. This further adds to the case that bulls may be better off waiting a bit longer before taking their trades. The next level above is the 0.5 Fib at $1.09315, and below is the 0.236 Fib at 1.0224.
Monthly Chart
Looking at the monthly chart, a morning star pattern formed a low at 0.9592, which may take a lot of Dollar strength to break. When we look at the 6E chart, if we see prices rallying, it means a strong Euro. If we see them falling, it means a weak Dollar. When the Fed holds its meeting next week, traders must be cautious of overleveraging because it will undoubtedly create a lot of volatility, especially in currencies.