Introduction
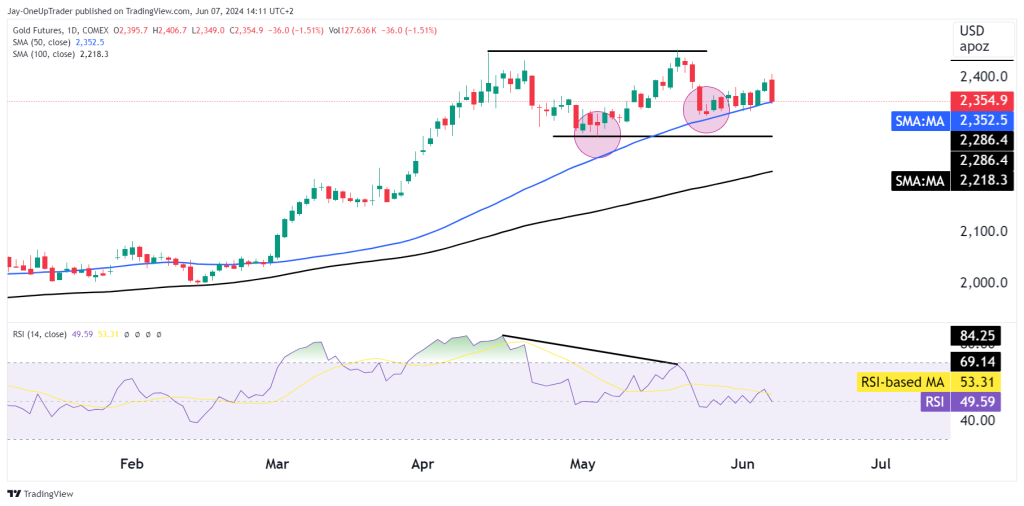
There is bearish divergence playing out on the daily chart for Gold futures. The daily candle we see forming today (7 June) is a big red one as buyers become exhausted. Is gold’s run coming to an end?
The chart provided is of Gold Futures (COMEX), with several technical indicators and patterns that can be analyzed for potential trading opportunities. Here is a detailed analysis:
Chart Overview
- Moving Averages:
- The 50-day Simple Moving Average (SMA) is at $2,352.5.
- The 100-day SMA is at $2,218.3.
Technical Patterns
Support and Resistance:
- The chart shows clear horizontal support and resistance levels. The support level is around $2,286, and the resistance level is around $2,400 – $2,500.
- The two circles on the chart are to reference the bearish divergence once price made a new higher low but the RSI did not confirm it.
Moving Average Support:
- The 50-day SMA is acting as a dynamic support level. The price is hovering around this moving average, indicating potential buying interest at this level.
RSI (Relative Strength Index):
- The RSI is currently at 49.59, which is close to the neutral zone (50). This indicates that the market is neither overbought nor oversold.
- There is a bearish divergence in the RSI. While the price made higher highs, the RSI made lower highs, suggesting a potential weakening of the bullish momentum.
Trade Opportunities
Bullish Scenario:
- Entry Point: If the price finds support at the 50-day SMA and the horizontal support around $2,286, this could be a good entry point for a long position.
- Target: The first target could be the resistance level around $2,400.
- Stop Loss: A stop loss could be placed just below the support level, around $2,270, to manage risk.
Bearish Scenario:
- Entry Point: If the price breaks below the 50-day SMA and the horizontal support level, it could indicate further downside potential.
- Target: The next support level could be around the 100-day SMA at $2,218.
- Stop Loss: A stop loss could be placed above the broken support level, around $2,300.