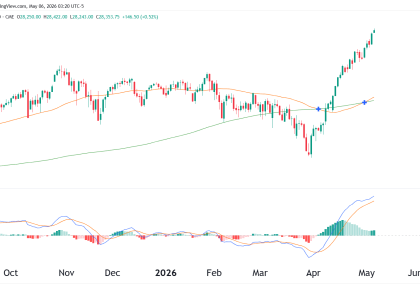
Weekly On the weekly chart, there is a hanging man candlestick, which may lead to a reversal or a significant pause in the uptrend. Given the strong uptrend with 14 green candles in the past 16 weeks, we would need further confirmation before considering this a top. Volume has been relatively steady, without any significant Read More…
Analysis
Interest Futures Edge Higher as Sales Decline Lifts Rate-Cut Bets
After a surprise decline in retail sales renewed rate-cut bets, interest futures rose on Thursday. On the other hand, the report sent Treasury yields lower. The decrease in retail sales indicated a slowing economy, reducing some of the impact of the upbeat inflation report on Tuesday. Meanwhile, investors also assessed labor market data. US retail Read More…
Oil Prices Take a Dive as Crude Inventories Soar
Oil prices fell on Wednesday due to a surge in crude inventories. When fuel stocks in the US increase, it is a sign that demand has dropped. WTI futures (Source: Bloomberg, EIA) Moreover, a drop in refining in the US led to a bigger-than-expected build in inventories. US refining slowed significantly during the cold weather. Read More…
Price Levels and Strategies: Technical Analysis of Crude Oil
Light Crude Oil Futures (Weekly Chart): Light Crude Oil Futures (Daily): Key Levels and Analysis: Trade Considerations: Market Sentiment:
Gold Futures Dip as US Inflation Remains Persistent
Gold prices plunged on Tuesday as the dollar and Treasury yields rose after an upbeat inflation report. After a long wait, investors finally saw the state of inflation in the US. According to the report, inflation remains persistent and higher than expected. Consequently, there was a decline in Fed rate cut bets. The outlook for Read More…
Nasdaq futures (NQ) sell-off in volume spike
Weekly Chart The weekly chart shows a strong uptrend with the Relative Strength Index (RSI) reading above 60, this is still strong bullish momentum. The volume on the weekly has been consistent as the trend continues to make higher highs. For traders looking to join the uptrend, a pullback toward the RSI-based Moving Average (MA) Read More…