

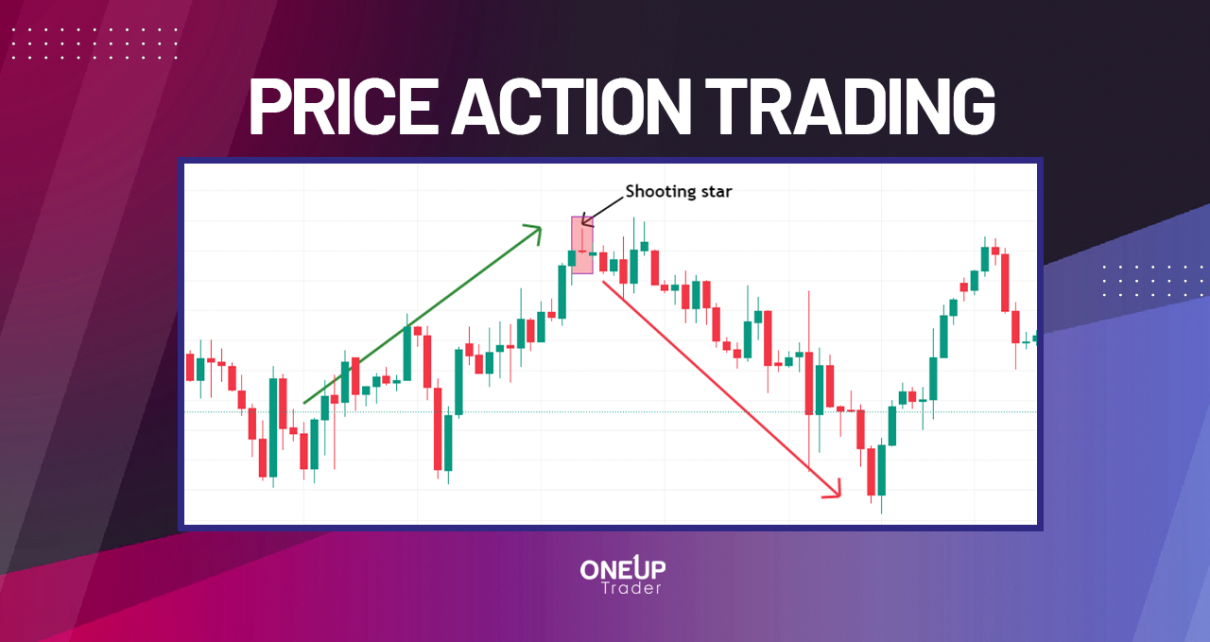
Despite their various advantages, nearly every technical indicator is faulted for lagging. Price action trading eliminates the overreliance on technical indicators simply by using candlestick and chart patterns to identify optimal entries and exits. The basis for price action trading is pure market movement; in a sense, price action trading is the foundation of all trading. And throughout this guide, we discuss the fundamentals of price action trading and how you can learn it.
What is Price Action Trading?
Price action is the study of an asset’s price movement over a given timeframe by observing the formation of candlesticks and chart patterns. So, price action trading is a trading strategy used to analyze an asset and identify the optimal entry and exit points solely based on its price fluctuation.
For price action traders, all information one needs about a specific market is displayed on its chart – no need for technical indicators. One could argue that price action trading is in line with the efficient market hypothesis, which states that all relevant information about an asset is already reflected in its price. In this case, an asset’s price action already reflects the sentiment and actions of traders.
Ideally, price action traders only emphasize an asset’s price movement with very little regard for technical indicators. Simply put, price action trading involves observing chart and candlestick patterns to anticipate an asset’s future price movement. It is the purest form of trading since, at its core, it works under the laws of supply and demand.
More buyers than sellers in the market mean they could be willing to pay whatever the sellers offer. That means when buyers continue to flock to the market, the prices continue to rise, resulting in an uptrend. Similarly, a higher number of sellers results in successive lower prices, causing a downtrend on the charts.
How to Learn Price Action Trading
As mentioned, price action trading primarily involves candlestick and chart pattern analyses. So, learning price action trading starts with understanding candlestick patterns.
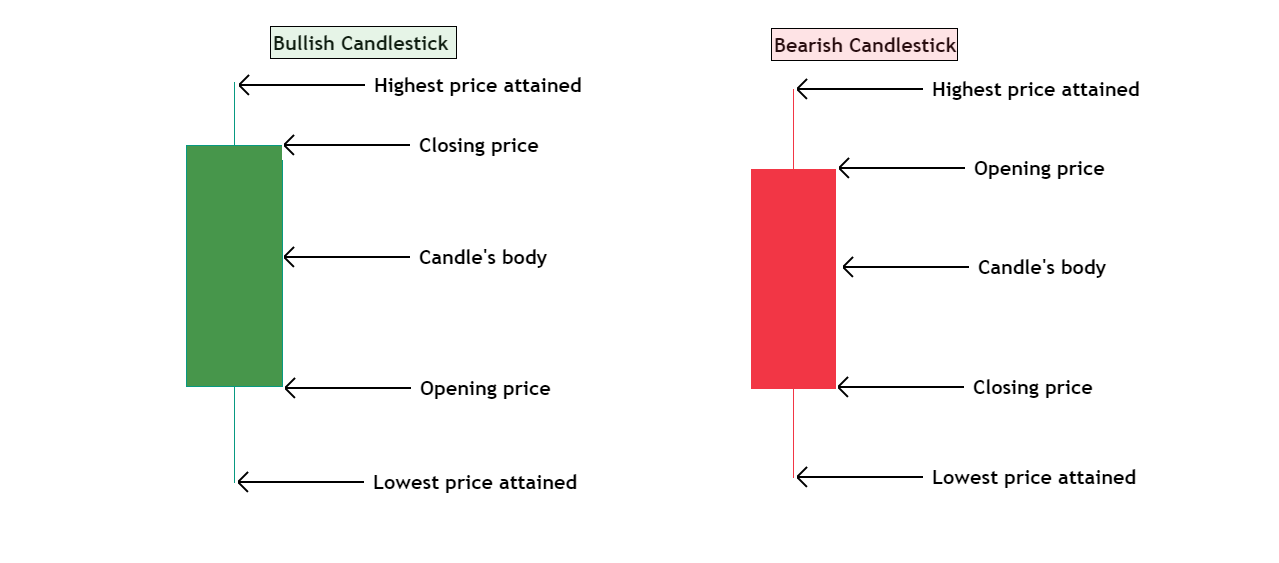
Anatomy of a Candlestick
A typical candlestick has a body and a wick (shadow). The body shows the opening and closing prices, while the wick shows the highest and the lowest price attained during a given timeframe. The upper wick shows the highest price during that timeframe, while the lower wick shows the lowest price. Candlesticks can either be bullish or bearish.
Candles with long bodies imply a strong trend – bullish or bearish – while candles with long wicks imply higher market volatility between open and close.
Different Types of Candlestick Patterns
Before we discuss the different types of candlestick patterns, let’s first go through the significance of a bullish long-wick candlestick and a bearish long-wick candlestick.
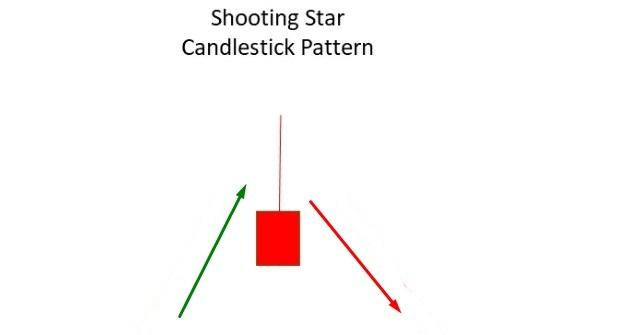
Wicks are meant to be considered levels of rejection. A bearish candle with a longer upper wick indicates a bearish trend – it shows that the market is dominated by sellers. So, if a candle with a long upper wick appears when the price action is in a bullish trend, chances are that a trend reversal is imminent. A perfect example is the shooting star candle.

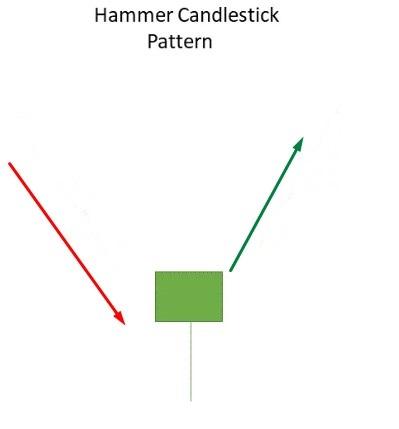
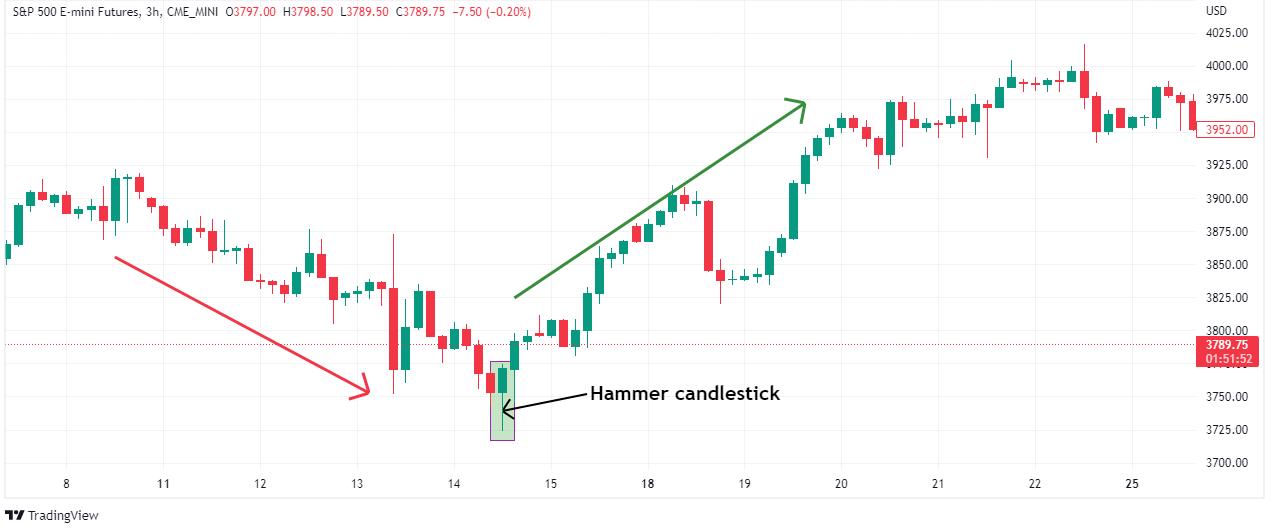
Similarly, a bullish candle with a long lower wick could be a bullish signal. It shows that buyers dominate the market, pushing prices higher. When such a candle appears in a downtrend, it signifies a possible bullish reversal. The Hammer candlestick is an ideal example.
These candlestick patterns can be categorized into single, double, and triple candlestick patterns depending on the number of candlesticks involved in determining a given pattern.
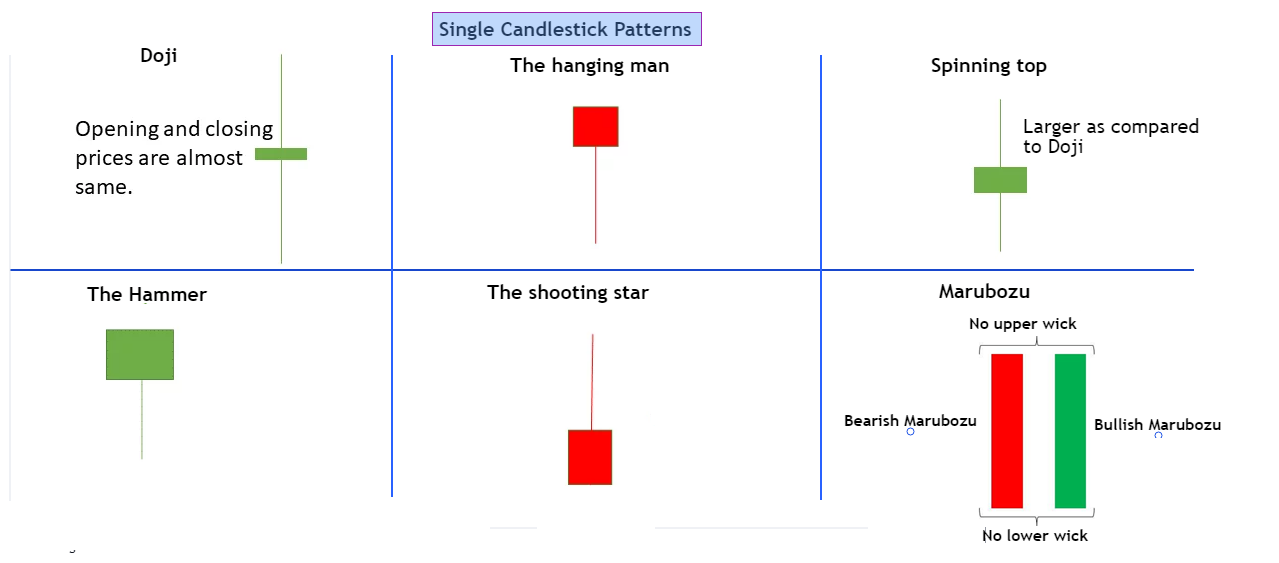
Single Candlestick Patterns
These candlestick patterns are formed by the appearance of just one candlestick. In this case, a trading signal is generated by the appearance of the pattern formed by this one candlestick. Examples of single candlestick patterns include;
- Marubozu candlestick pattern
- The Doji
- Spinning top candlestick pattern
- The hanging man
- The Hammer
- The shooting star
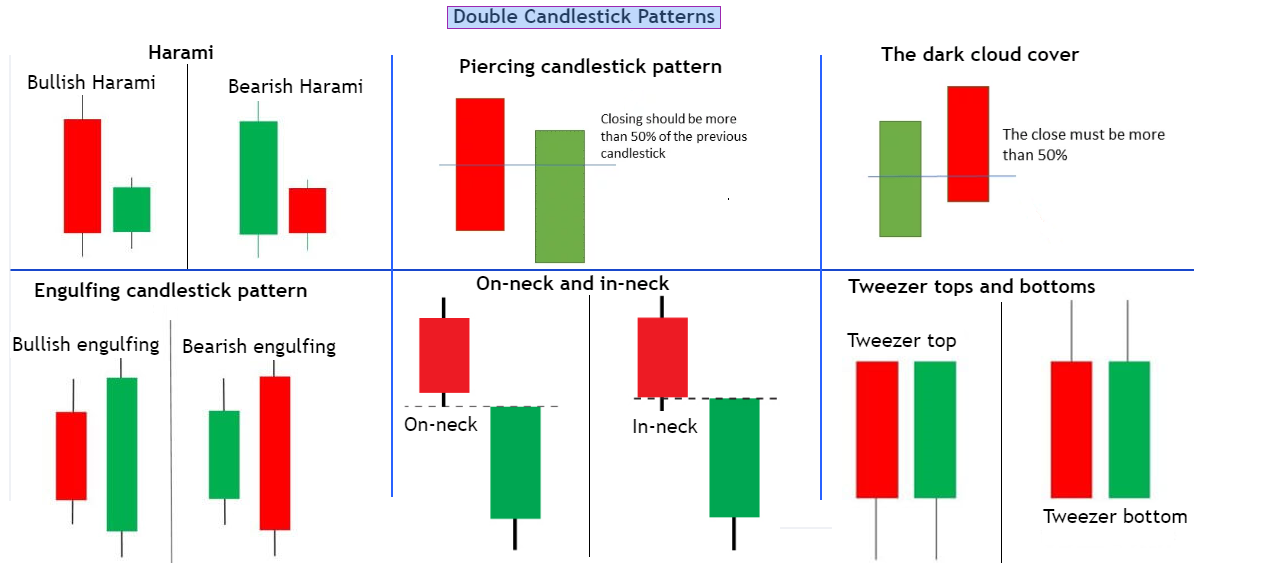
Dual Candlestick Patterns
As the name suggests, these candlestick patterns are formed when two candlesticks appear together. They include:
- Engulfing candlestick pattern
- Tweezer tops and bottoms candlestick patterns
- Harami candlestick pattern
- Piercing candlestick pattern
- On-neck and in-neck candlestick patterns
- The dark cloud cover candlestick patterns.
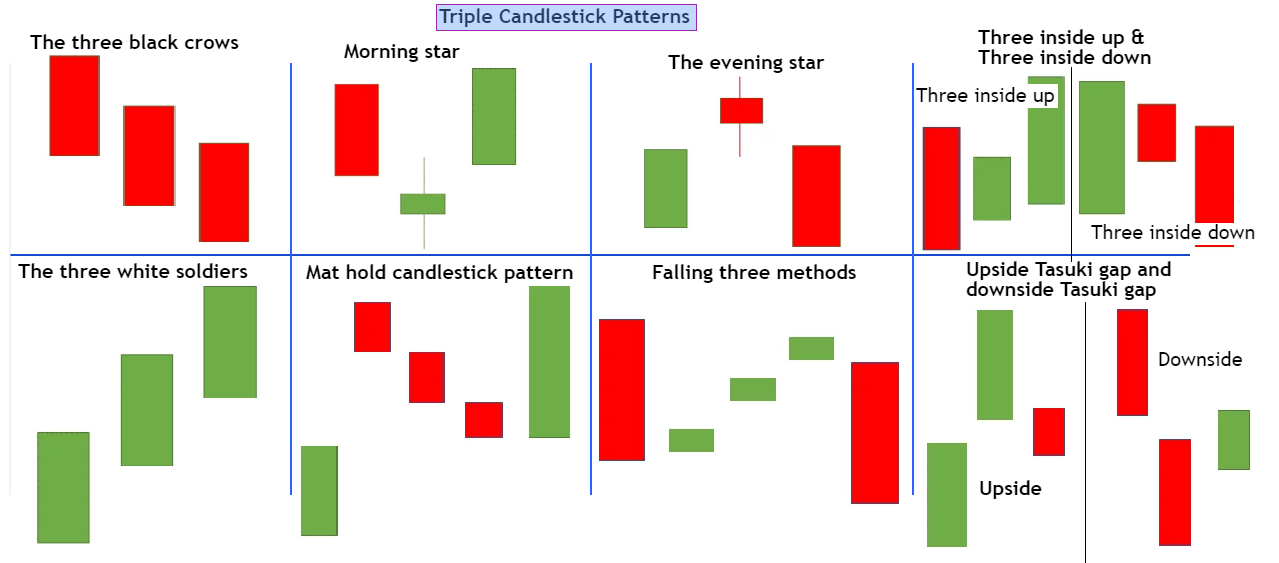
Triple Candlestick Patterns
The triple candlestick patterns form when three distinct candles appear in succession. They include;
- The three white soldiers candlestick pattern
- Falling three methods and the rising three methods candlestick patterns
- Morning star candlestick pattern
- Three inside-up and three outside-up candlestick patterns
- The evening star candlestick pattern
- The three black crows
- Upside Tasuki gap and downside Tasuki gap
- Mat hold candlestick pattern
Timeframe Analysis
Timeframe analysis involves observing the price action of a particular asset over different timeframes. This allows you to gauge the short, medium, and longer-term overall trend. It is essential in observing trends and determining the optimal entries and exits. The idea behind multiple timeframe analysis is to ensure your trading is consistent with the market trend and also helps you to identify the key levels of support and resistance.
When using multiple timeframe analyses, your preferred timeframes will depend on your trading style. However, it is customary to use a longer timeframe to establish the dominant market trend, which gives you an understanding of the prevailing trend to anchor your entry. It also helps you establish support and resistance. These are ideal for determining exit points.
Afterward, you can use a shorter timeframe to identify the best entry point. Unless you’re using a specific price action trading strategy, breakout trading could help identify the optimal entry.
Note that depending on your risk appetite, you can use the support and resistance levels from the intermediate or longer-term timeframes as your exit levels. Identifying the precise entry point will depend on which price action trading strategies you implement. And these can be based on specific candlesticks and chart patterns.
Price Action Trading Strategies
As is with any trading strategy, price action trading strategies have two primary objectives. The first step is to identify the prevailing market trend and then identify the optimal entry and exit points. Price action trading strategies work on the basis that history always repeats itself. Admittedly, price action trading has a broad scope. However, it heavily relies on trend following and breakout trading, which means all price action trading strategies can be categorized into continuation, reversal, or neutral price action trading patterns.
Typically, the price action fluctuates between bullish and bearish trends with momentary neutral phases in between. A neutral trend occurs when the market is transitioning in a continuous or reversal trading pattern. This means the price action is neither bullish nor bearish and often within a horizontal channel. Most of the time, this happens when the market sentiment is neutral.
With this in mind, let’s discuss continuation and reversal price action trading strategies.
Continuation Trading Patterns
Continuation trading patterns are candlestick and chart patterns that signal that the observed dominant trend will continue. Continuation candlestick and chart patterns usually form after a consistently trending market consolidate before proceeding with the initial trend. They can be classified as bullish or bearish continuation patterns.
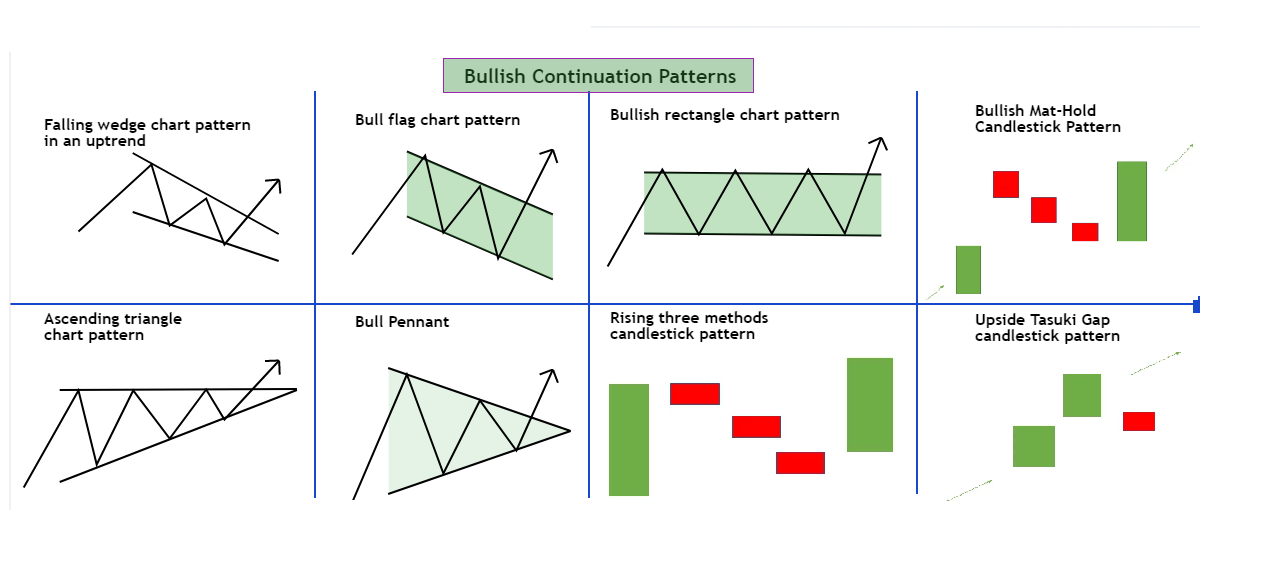
Bullish Continuation Patterns
Bullish continuation candlestick and chart patterns signal that the previously observed bullish trend will continue. Here are some of the top bullish continuation patterns for price action trading.
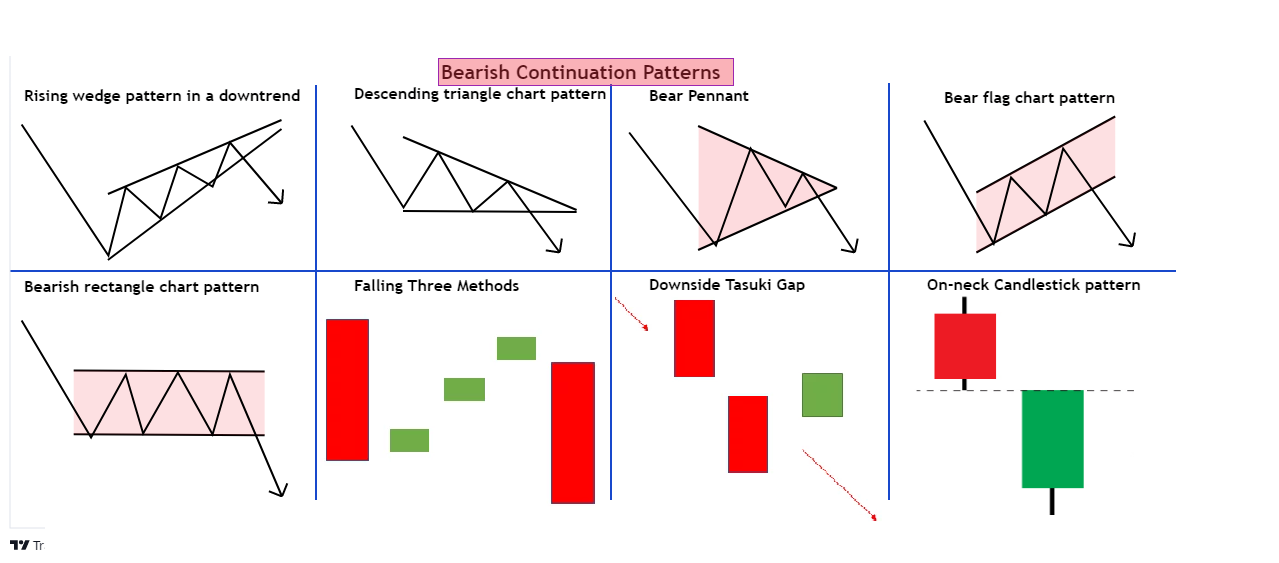
Bearish Continuation Patterns
Bearish continuation candlestick and chart patterns signal that the previously observed bear trend will continue. Here are some of the top bearish continuation patterns for price action trading.
Reversal Trading Patterns
Reversal trading patterns are candlestick and chart patterns that mark a period where the prevailing market trend shifts into an opposite trend. If you spot a reversal pattern in an uptrend, it signals the possible change from a bullish to a bearish trend. Similarly, a bearish reversal pattern forming in a downtrend signals that the price action could change from bearish to bullish. They can also be classified as bullish or bearish continuation patterns.
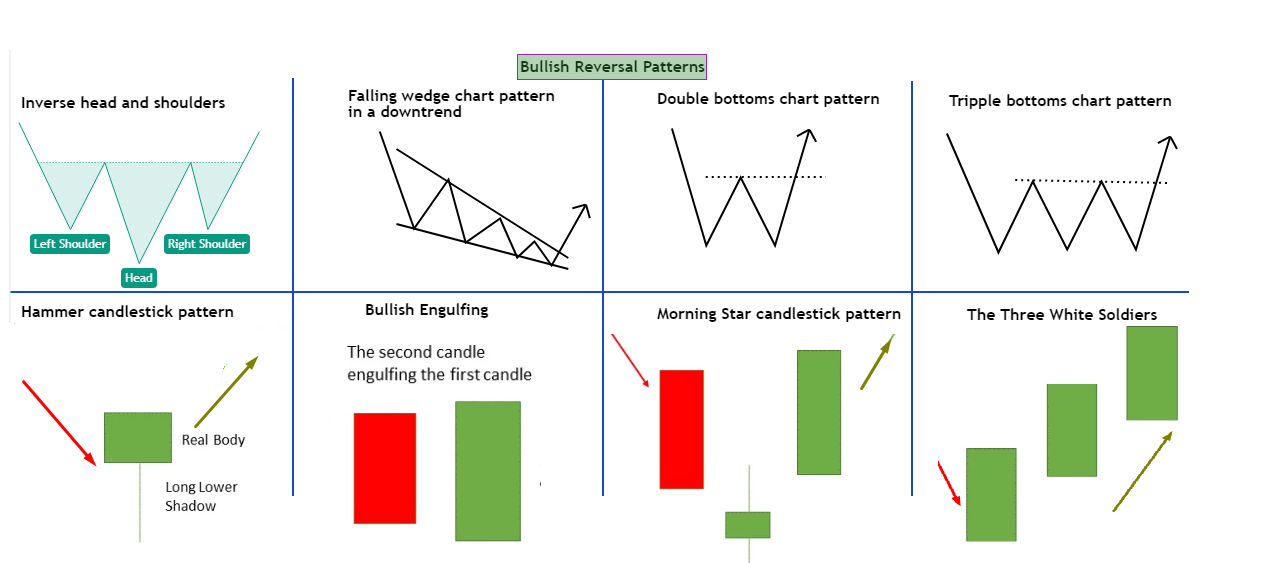
Bullish Reversal Patterns
Bullish reversal candlesticks and chart patterns indicate that the current downtrend is ending and could reverse to an uptrend. They show bearish to bullish reversal. Here are some of the popular bullish reversal patterns:
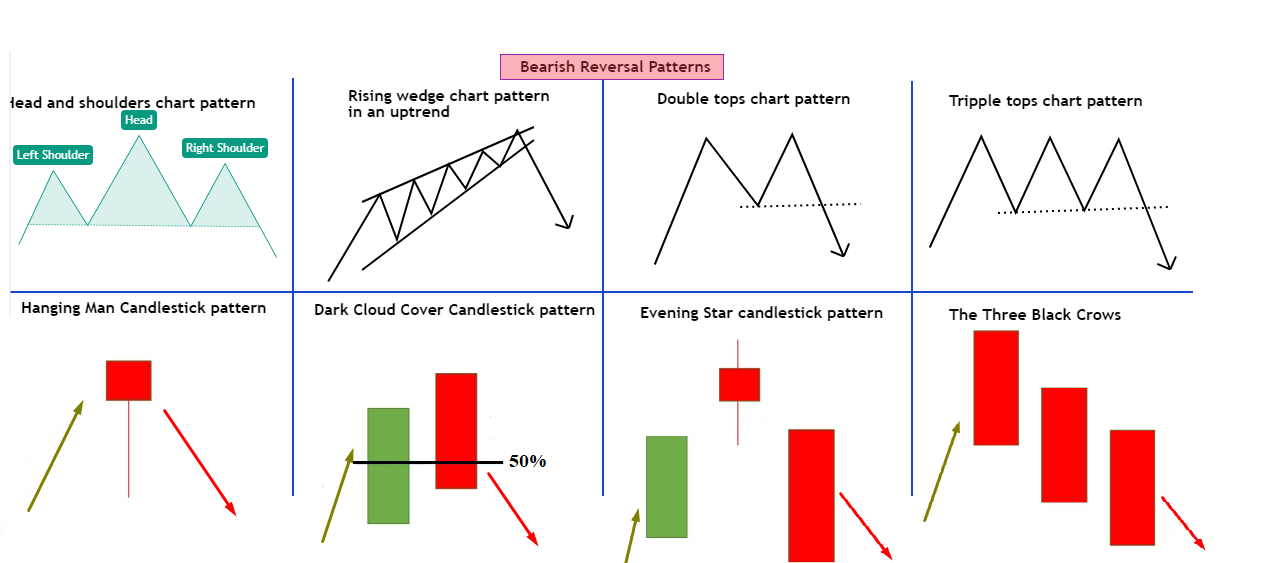
Bearish Reversal Patterns
Bearish reversal candlesticks and chart patterns indicate that the current uptrend is ending and could reverse into a downtrend. They show a reversal from a bullish to bearish price action. Here are some of the popular bearish reversal patterns:
The Bottom Line
Price action trading is a trading strategy that involves analyzing an asset and identifying the optimal entry and exit points solely based on its price fluctuation. Since candlestick and chart patterns are the backbone of price action trading, their knowledge is vital regardless of the type of trader you are. And that’s why we’ve discussed how you can identify these patterns, along with some of the top price action trading strategies.
For an overview of candlestick charts and patterns, read our blog on How to Read Candlestick Patterns.


