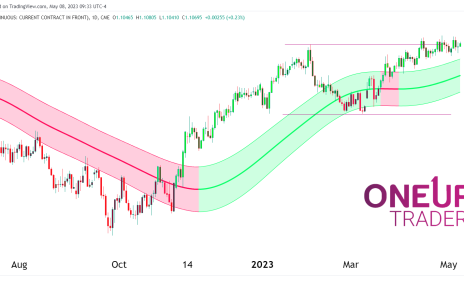
- Potential short-term bullish reversal on CL
- Short Trade running out of steam
- Bullish divergence forms on MACD
Bulls vs Bears
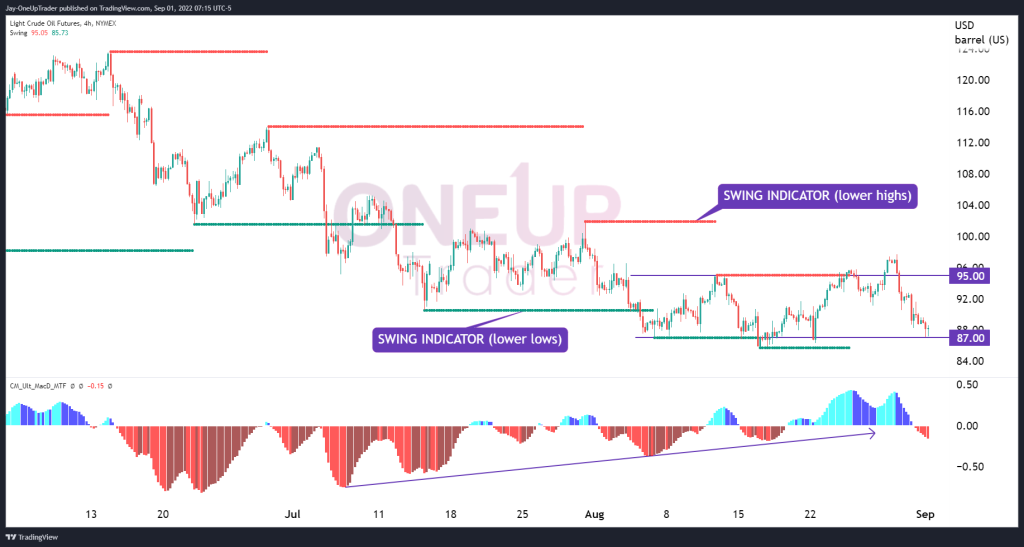
On the 4-Hour chart, we clearly see a consolidation zone forming on the CL chart between $87 and $95. This is happening after a two-month downtrend.
The swing indicator is showing lower lows are being taken out several times and are getting closer and closer to one another; this is a signal that either a consolidation is forming for a further move to the downside or the overall downtrend is weakening. The lower highs, however, are still moving well apart from each other and this is telling us a potential short squeeze is on the horizon.
MACD
The MACD deserves a paragraph all to itself because of the strong bullish divergence it is indicating. We can see that from mid-July, the indicator’s red histogram has slowly been printing higher on each successive dip, further adding to the consolidation consensus. When we see the MACD behave like this, it suggests that each move down has less selling pressure, though it is still stronger than the buying pressure. Nonetheless, it could be weakening, and the short trade may be fatigued for the time being..
The Trade
From the analysis above, we must not jump to the conclusion that we are expecting a massive bull run to occur. Looking at the chart, the short trade is overextended, and we see a greater probability of a move higher from here. Our upside is capped at the $95 level, so traders taking longs have a clearly defined risk of stop losses below the $87 consolidation zone. The width of those stop losses comes down to the trader’s preference; keep in mind CL is very volatile, and we could see wicks down below $87 before it moves back into the zone.