


As we step into the first quarter of 2024, Bitcoin will be on the forefront of investing news as we await the bitcoin ETF. The price for BTC futures has seen a significant 162% YTD return. With the halving coming shortly, what do we expect for BTC? Here’s a technical breakdown of the current market structure and potential strategies.
Weekly Chart Analysis
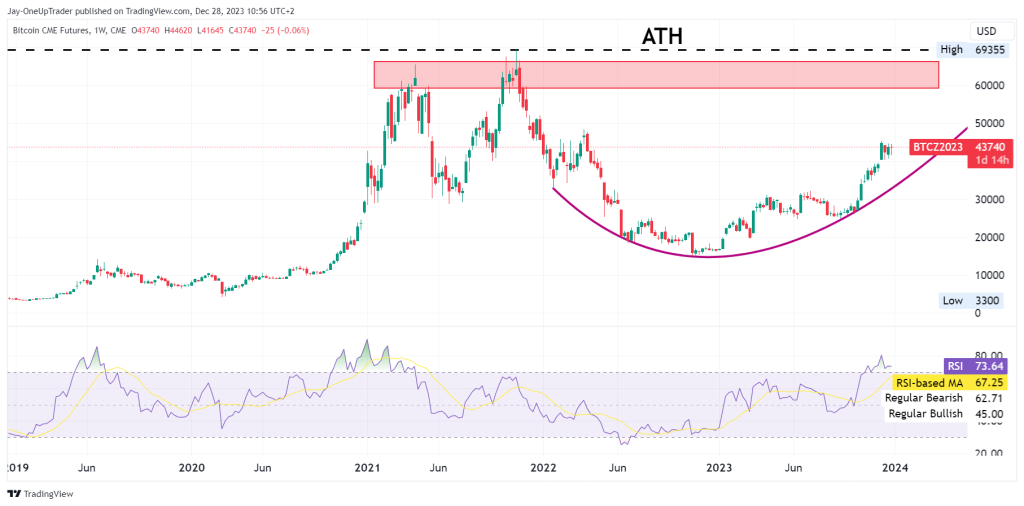
The notable feature on the weekly is the rounded bottom formation, which is a parabolic curve, which the price has been respecting so far.
Resistance at All-Time High (ATH): The chart highlights a significant resistance zone around the ATH near $69,355.
Current Price Action: As of the last candle on the weekly, Bitcoin is trading at $43,740. There’s a clear uptrend in place, evidenced by consecutive higher lows along the curve.
RSI Overbought: The RSI is dangerously overbought suggesting that there may be a small pullback coming soon.
Moving Forward: If the bulls maintain their momentum, we could see the price level break through the resistance of the ATH. A weekly close above this level would confirm the breakout, potentially setting up a long position with a target at new highs.
Daily Chart Breakdown
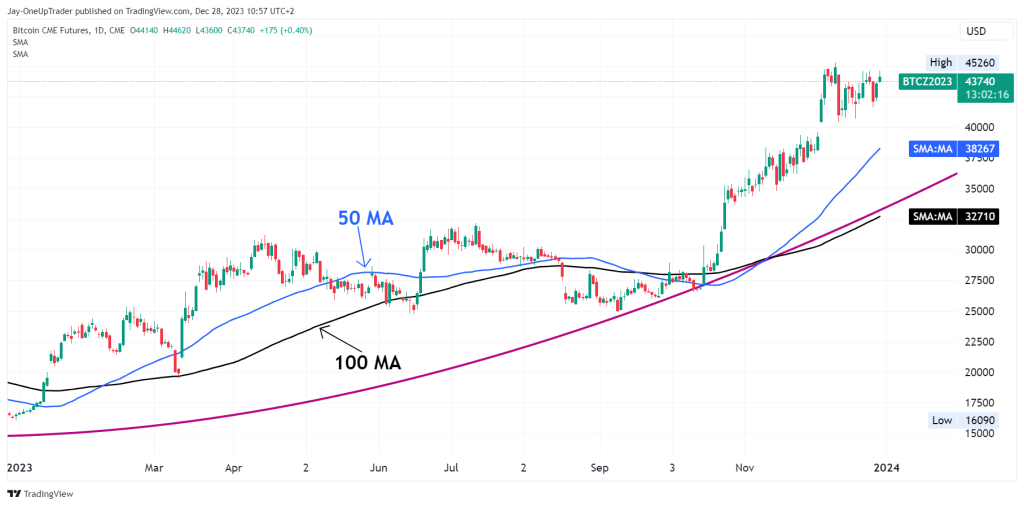
- 50-Day SMA: The 50-day SMA has been serving as dynamic support. The price is hovering around the $43,740 mark, sitting slightly above this moving average, which indicates continued support.
- 100-Day SMA: Similarly, the 100-day SMA has been acting as a support level. The price has tested and bounced off this line, reinforcing bullish control and the overall uptrend.
Trade Strategy:
- For Long Positions: Traders might consider entering a long position if the price sustains above the 50-day SMA, with a stop loss below the 100-day SMA to manage risk. The immediate target could be set near the $45,260 region, where recent highs are observed. Targets could also be set at all-time highs and above for longer-term strategies.
- For Short Positions: A break below the 100-day SMA could signal a shift in momentum, justifying a short position. The objective in this scenario would be the previous support level, which could be around the $32,710 mark, aligning with the 100-day SMA. There is also the ‘buy the rumor, sell the news’ scenario here, where the market might sell off on news of the Bitcoin ETF officially being launched.
