- The recent price action and how it signals further bearish momentum
- Analysis of the downward trend line, the anchored VWAP, and the Fibonacci retracements
- Potential targets bears could be looking to re-enter short positions
Understanding Recent Price Action
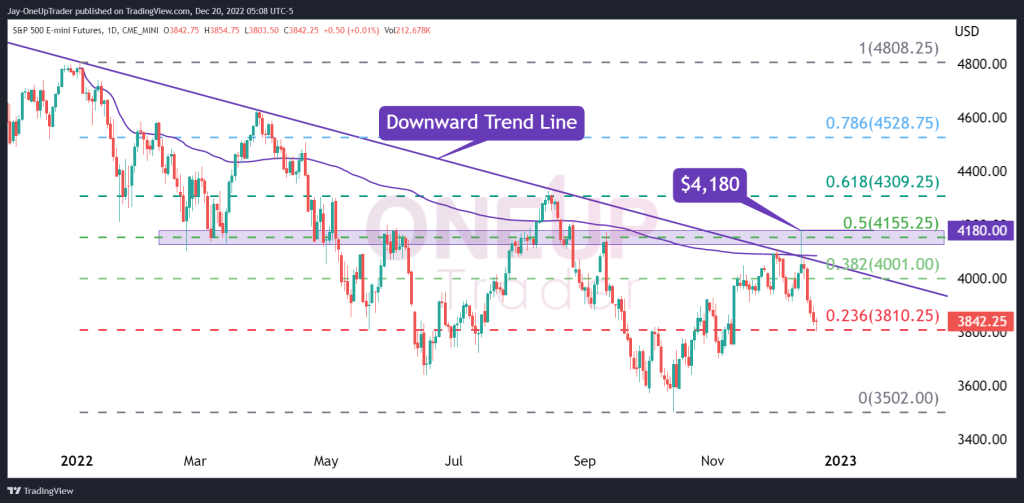
The long-term downtrend line continues to act as resistance as the CPI report shot the price through the level but ended up being a fakeout as ES has dipped 9% since that high made on December 13th. The high of that candle is $4,180 and it really will be a stretch for bulls to break that high, especially after the Fed’s comments last week about continuing to raise interest rates into 2023 until they reach their inflation target of 2%. Let’s look at some of the factors influencing our analysis and potential levels the market could target in the near future.
Downward Trend Line
This is the 5th connection point for the line and there is no sign as of yet that this will not continue. For now, the line tells us the medium-term trend is bearish and will remain that way until a clear break above the $4,180 level mentioned above is broken.
Anchored VWAP
Anchoring the VWAP to the high on Jan 4th of this year, we see the market sells off from the VWAP but ultimately comes back toward it. It has happened multiple times and even though it doesn’t act as a strong resistance, the price generally goes for another large leg down after testing it. If history is going to repeat itself then it would suggest ES has a fair bit to move to the downside.
Fibonacci Retracements
Connecting the Fib retracements from the high of the year to the recent major low, we saw a rejection off the 0.5 level on the CPI release. Prices have recently fallen to the 0.236 level and have immediately bounced from it.
Targets
ES appears oversold a the moment and with the 0.236 acting as a support, bears may be better off waiting for a retracement before shorting. If they sell this market now, they would be chasing the trend. Possible retracements to $3,910.50 may be a great area to short, the question is whether the price will get there for the opportunity to be available.
In the likely event the bearish momentum continues, the lows of $3,600 would be the most obvious target once the 0.236 Fib level has been breached.
Summary
With confirmation from the Fed that they will continue raising rates until their target of 2% is met, it’s difficult to find a bullish case in the markets right now. The three technical indicators above all point toward further downward pressure but ES does look overbought at the moment so it’s probably a better idea for traders to wait for a small relief rally to begin initiating shorts.