Introduction
Gold has been the standout so far this quarter as geopolitical tensions persist. It is not only acting as a safe haven, but the chart has some great formations we can take advantage of.
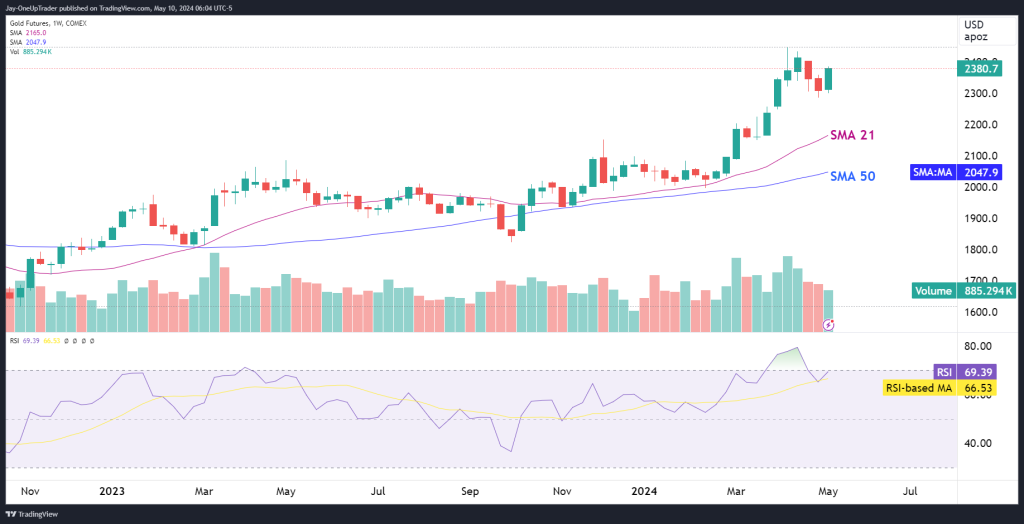
The daily chart shows just how strong the trend has been since November 2023, with the 21-week Simple Moving Average (SMA) positioned above the 50 SMA, a classic indication of bullish sentiment. The price action remains above both SMAs, further confirming the strong trend.
The latest candle is bullish and has engulfed the previous days. Bulls now want to see the ATH taken out at $2448.8.
Trading volume has shown moderate volatility recently, with a small decrease in the past few days. This reduction could indicate a consolidation phase or a temporary decrease in conviction among traders.
The RSI is overbought at the moment, but I don’t think it is something to worry about. We have seen many times how when there is a strong trend, the RSI remains overbought. The signal should rather be interpreted as a signal to avoid adding to long positions instead of a straight sell signal.
Short-Term Signal
In the short term, we must be cautious because the RSI is nearing overbought levels, so it is probably better to avoid adding longs for now, even if the market looks like it’s about to move higher. A pullback or sideways movement may occur as the market digests recent gains.
Medium-Term Signal
The medium-term outlook suggests that any short-term pullback could present a buying opportunity as long as the price remains above the 50-week SMA. We can look for confirmation of the bullish trend continuation through sustained price action above the SMAs.
Long-Term Signal
The well-established bullish trend, supported by the positioning of the SMAs, provides a positive long-term outlook for Gold Futures. However, monitoring the volume and RSI for any signs of trend exhaustion or reversal is crucial. A significant divergence between the price action and these indicators could signal a potential shift in the long-term trend.
Continued economic uncertainties and inflationary pressures could fuel further increases in gold prices. Traders should watch for sustained price action above the 21-week SMA, as this would confirm the ongoing bullish momentum.