

Introduction
The E-Mini Russell 2000 Index Futures are approaching an all-time high (ATH). The technical analysis of both weekly and daily charts are catching up to the bigger indices that have already broken their previous highs.
Weekly Chart Analysis
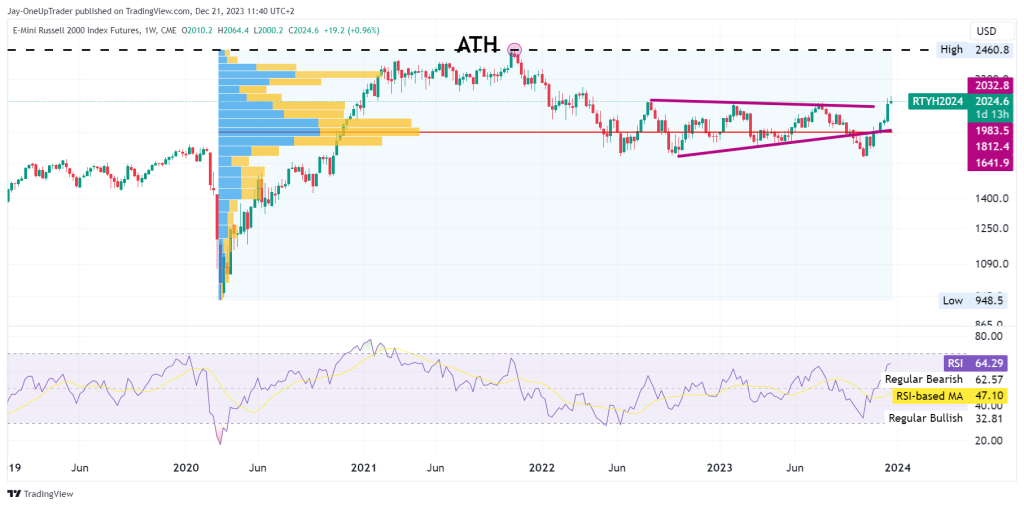
On the weekly chart, we see that the RTY futures are within a symmetrical triangle pattern, a consolidation pattern that typically follows a significant bullish trend. The narrowing price action tells us there is indecision among traders but maintains the higher lows, indicative of underlying bullish sentiment.
The volume profile highlights a concentrated trading volume around the mid-range of the triangle, signaling this as a potential pivot area. The RSI is hovering above the midline, supporting the notion that there might still be more bullish momentum in the tank.
Daily Chart Analysis
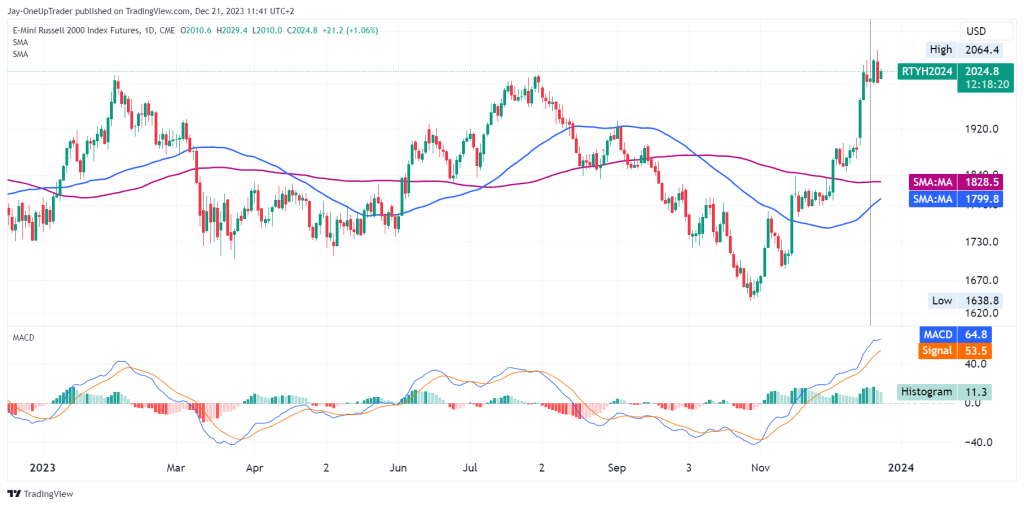
The daily chart shows a recent bullish breakout, with the index pushing towards the upper boundary of the triangle observed in the weekly chart. The price is trading above both the 50-day and 200-day Simple Moving Averages (SMA), a bullish signal for trend traders. The most important thing to watch now is that price remains above the high of the triangle, and it begins to act as support.
The Moving Average Convergence Divergence (MACD) is in positive territory, and the histogram reflects growing bullish momentum. The macd is at its highest level since 2021 and its something bulls need to be watching closely.
Key Levels to Watch
Immediate resistance is the ATH. A decisive breakout above this level could signal a continuation of the bullish trend. Key support levels lie at the lower trendline of the triangle pattern, and the 50-day and 200-day SMAs will also act as dynamic support levels.
At the moment there it is difficult to find buying opportunities as RTY has been on a tear the past few weeks. Bulls might be better off waiting for a pullback to the upper band of the triangle before initiating buys.
