

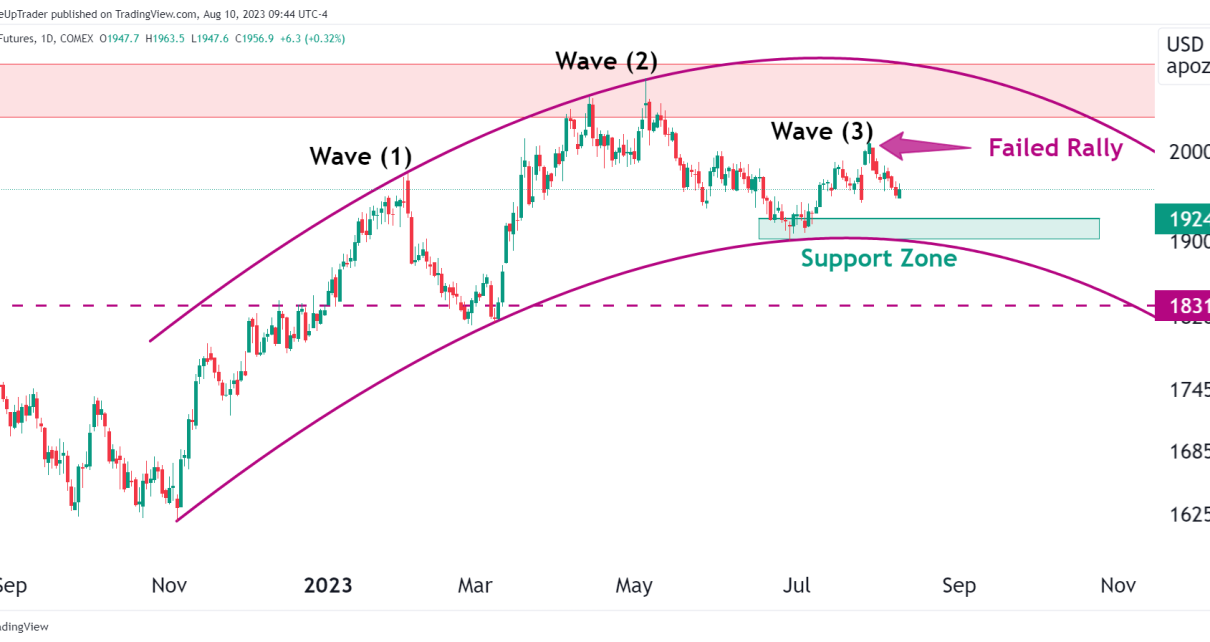
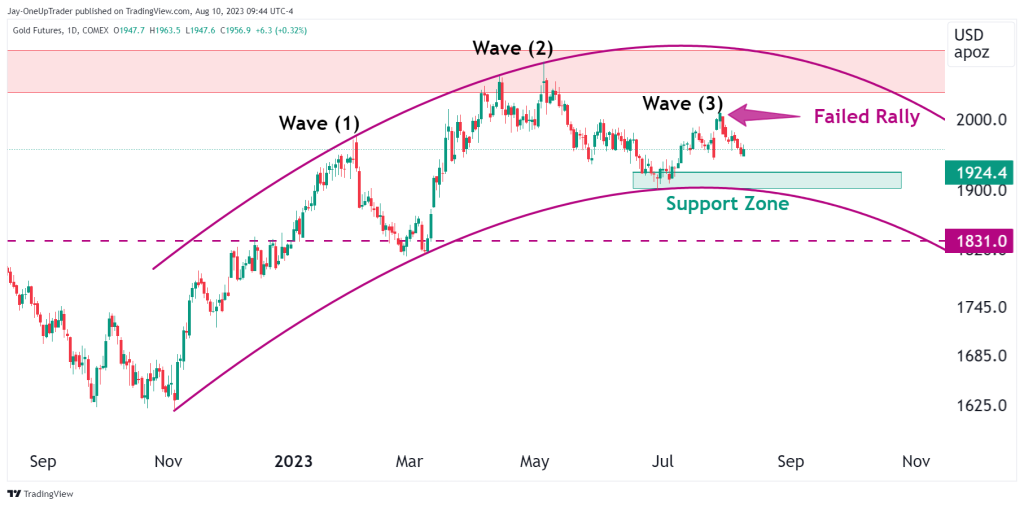
- Recap on the weekly chart triple top formation on GC.
- Parabolic curve and support zone give hope for the bulls.
- Remember to keep strict risk management rules in place.
Introduction
The most prominent feature on the Gold chart the last time we looked at it was the danger of a triple top formation on the weekly time frame. This is still a worry for the bulls but there is some hope for them in the form of a parabolic curve and a minor support zone where potential entries can be taken.
Technical analysis
Parabolic curve: The parabolic channel provides us with a dynamic way of looking at support and resistance and there is an opportunity we can wait for to take a long position. We don’t need to put too many indicators or drawings on the chart to see this one because the support speaks for itself. It is at $1,924.4 and it also lines up with the parabolic curve. If price falls within the zone, and we see a reversal in the form of a candlestick pattern or consolidation period, then that could be the time to go long.
The concern is if price falls below that level because that would line Gold up for a deeper correction due to the formation of a 1-2-3 reversal. That could send GC down to $1,831.
Important note
In a trade like this, getting overly excited and thinking there is no way it could fail can be tempting. Always be aware of yourself when that happens because that is pure speculation and emotion. If that occurs, step back and remind yourself to think in probabilities. Keep strict money management rules in place and concentrate on placing the best trades you can possibly take.