Weekly
On the weekly chart, there is a hanging man candlestick, which may lead to a reversal or a significant pause in the uptrend. Given the strong uptrend with 14 green candles in the past 16 weeks, we would need further confirmation before considering this a top. Volume has been relatively steady, without any significant spikes, suggesting that there hasn’t been a rush to exit positions.
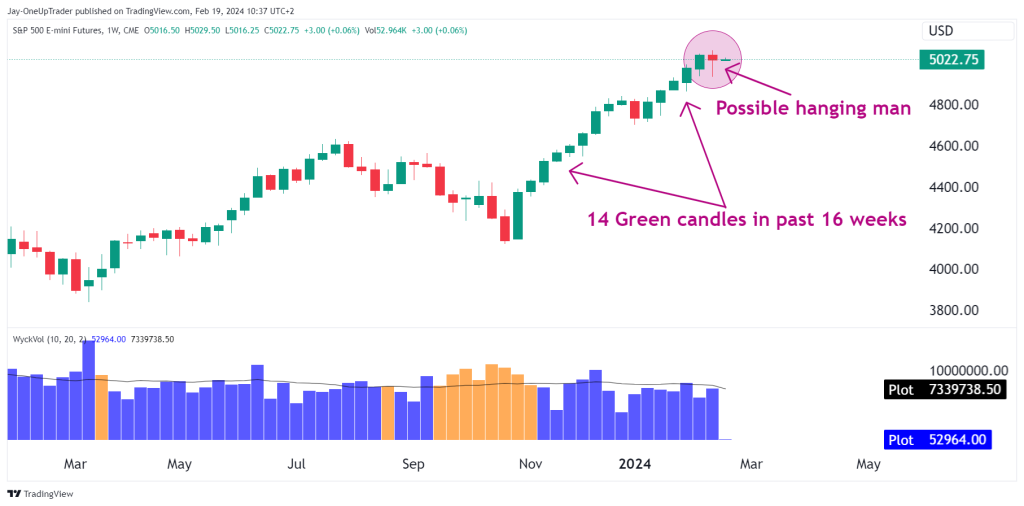
Key Levels to Watch on the Weekly:
- Immediate Support: The area around 5000 has been a psychological level, and a sustained hold above this is critical for the uptrend to persist in the short term.
- Potential Reversal Confirmation: If subsequent candles form lower lows, we could consider the hanging man as a reversal indicator.
Daily
The daily charts clear uptrend has price action above both the 50-day SMA (4856.60) and the 200-day SMA (4516.17). The trend magic at 4999.40 is currently acting as immediate support. The Awesome Oscillator (AO) is showing diminishing green bars, which could signal a slowdown in momentum, but not necessarily a reversal.
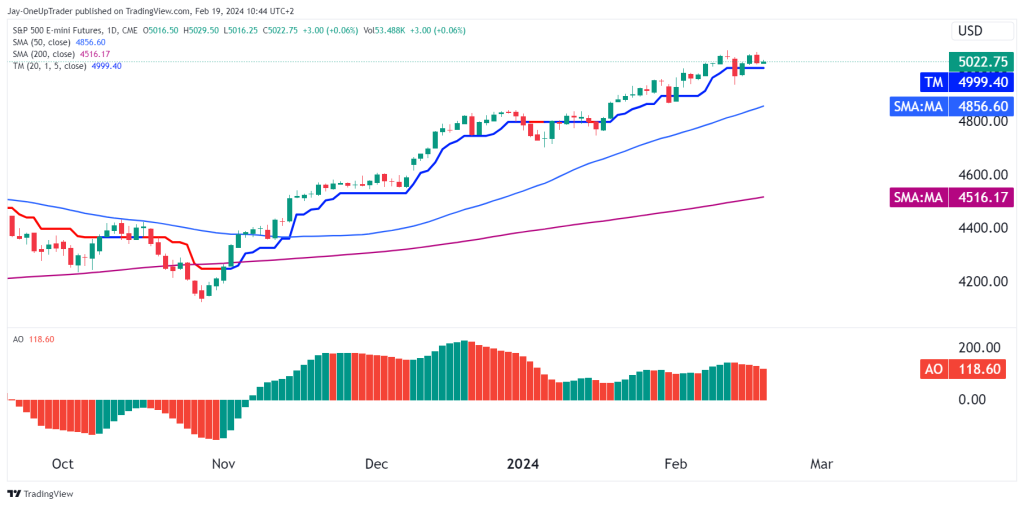
Key Levels to Watch on the Daily:
- Support: The TM at 4999.40 is our first line of defense for the bulls.
- Resistance: We may look for the 5100 level as a potential target for the bulls if momentum picks up again.
Hourly
The 1-hour Heikin Ashi chart shows a period of consolidation, with the price oscillating around the pivot point at 5006.50. The smooth nature of Heikin Ashi candles indicates that the trend is currently in a phase of indecision.
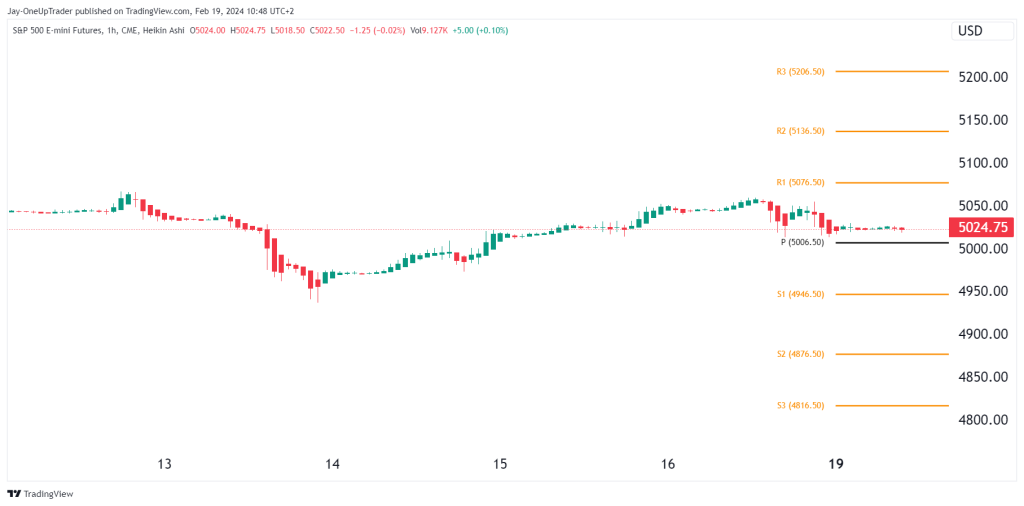
Key Levels to Watch on the Hourly:
- Resistance 1 (R1): At 5076.50, a break above could lead to a test of higher resistance levels.
- Support 1 (S1): At 4946.50, this level could act as a potential entry point for bullish trades if the price dips but remains in the overall uptrend.
Potential Trades:
- Bullish Scenario: Look for entries on a bounce from the TM at 4999.40 or the pivot point at 5006.50, with a stop loss below S1 at 4946.50 and a target of R1 at 5076.50.
- Bearish possibility: Should we break below the TM at 4999.40, consider short positions with a target of S1 at 4946.50 and a stop loss above the TM but this is risky and against the major trend.
Rating and Final Thoughts:
Considering the trend and the current chart setup, our rating remains Bullish on the S&P 500 E-mini Futures (ES). Despite the potential hanging man and the slight loss in momentum indicated by the AO, the overall trend remains up, supported by key moving averages. Remember, the trend is your friend until it bends at the end, and right now, it shows no signs of bending. We stand ready to adjust our view if the price action dictates, but for now, we hold our bullish course.