

What Is Trend Trading?
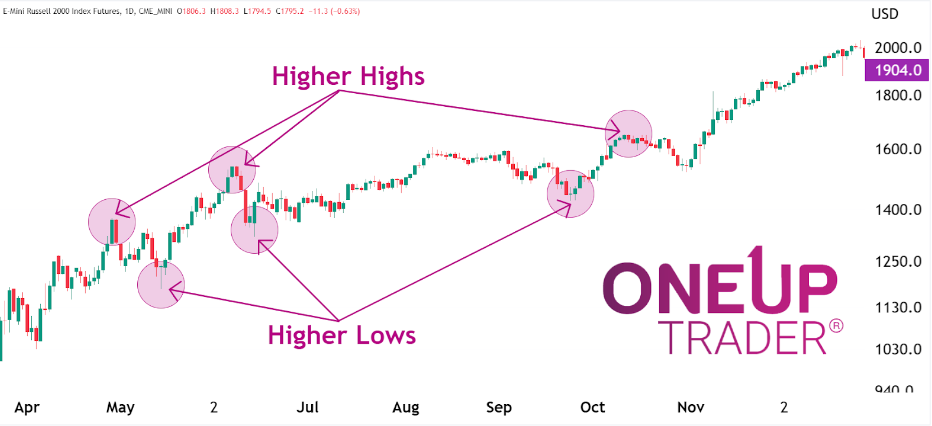
Trend trading is one of the most popular strategies in financial markets, appealing to both novice and seasoned traders alike. At its core, it simply involves identifying and following the direction of market movements, which is why it is important to understand how to read trends correctly and if there is a specific trend indicator you should use. Higher highs and higher lows technically define an uptrend, while lower lows and lower highs technically define a downtrend. Traders need to have a good understanding of market cycles and technical analysis in order to trend trade correctly.
The simplicity and adaptability of trend trading are what make it so effective. Regardless of market conditions, trends will always exist. The real skill lies in identifying them. This is where trend indicators and the ability to read them come into play. These tools help traders recognize emerging trends and determine their strength and longevity.
But what exactly are the best trend trading indicators, and how can they be used properly? From classic trendlines that show market direction to complex multi-layered predictive oscillators, the range of available tools is extensive. Each indicator has unique strengths. Choosing the right combination can mean the difference between success and failure in trend trading.
This article takes a deep dive into trend trading, focusing on indicators and strategies you can use.
What is a trend indicator?
Trend indicators attempt to provide an objective measure of the trend’s direction. Price data is smoothed, and the trend is represented by a single line, as in the case of a moving average.
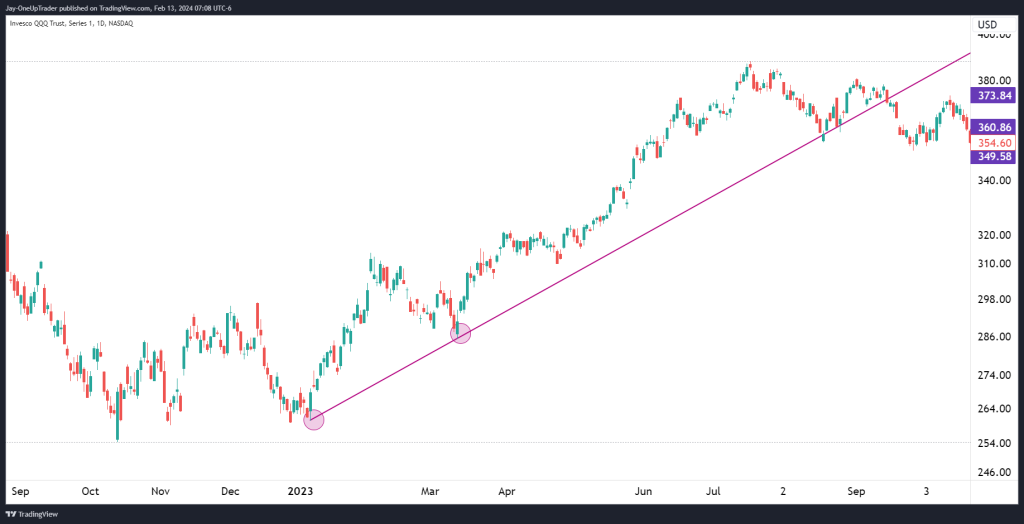
Trend Line Indicator:
A fundamental tool in any trader’s arsenal, the trend line indicator involves drawing straight lines on a price chart. These lines connect a series of price points and help identify the direction of the market trend. An upward trend line is drawn along the lowest price points of the trend period, indicating a bullish market. Conversely, a downward trend line connects the highest price points, signaling a bearish market. This simple yet powerful tool helps traders visualize market trends. If price remains above an upward-sloping trend line, the market is bullish, and when it breaks, the uptrend is likely to pause or reverse.
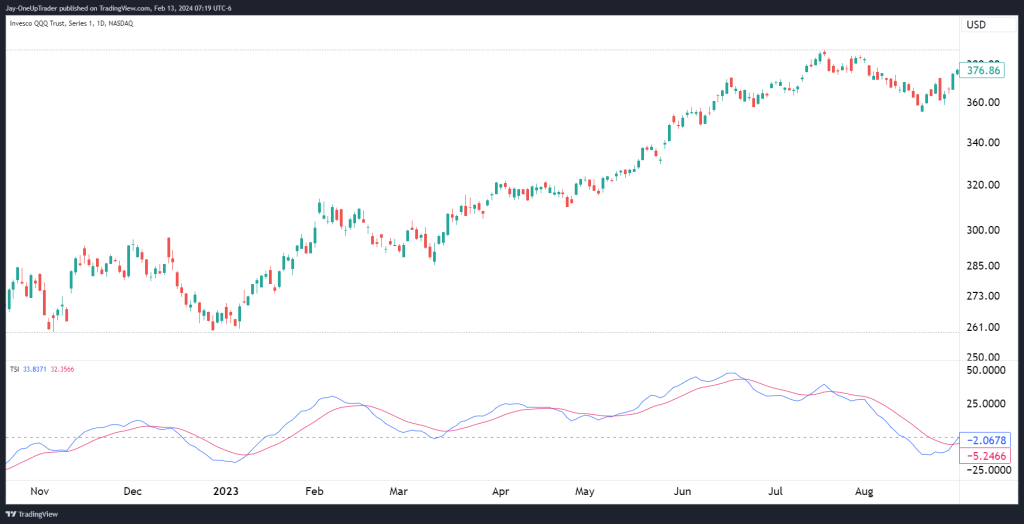
Trend Strength Indicator
Determining the strength of a trend is crucial for assessing its viability. The Trend Strength Indicator (TSI) is designed for this purpose. It measures the magnitude of price changes over a specified period, providing insights into the trend’s sustainability. A high TSI value suggests a strong trend, either bullish or bearish, indicating a higher likelihood of continuation. Conversely, a low TSI value points to a weak trend, signaling potential reversals or market indecision.
Trend Reversal Indicator
Identifying the point at which a trend reverses is vital for risk management. The Trend Reversal Indicator helps traders spot these turning points. It combines various data points, including price movements, volume, and historical patterns, to predict potential reversals. Traders use this indicator to exit positions before a trend reversal occurs, protecting their investments from sudden market shifts.
Best trend indicator for day trading
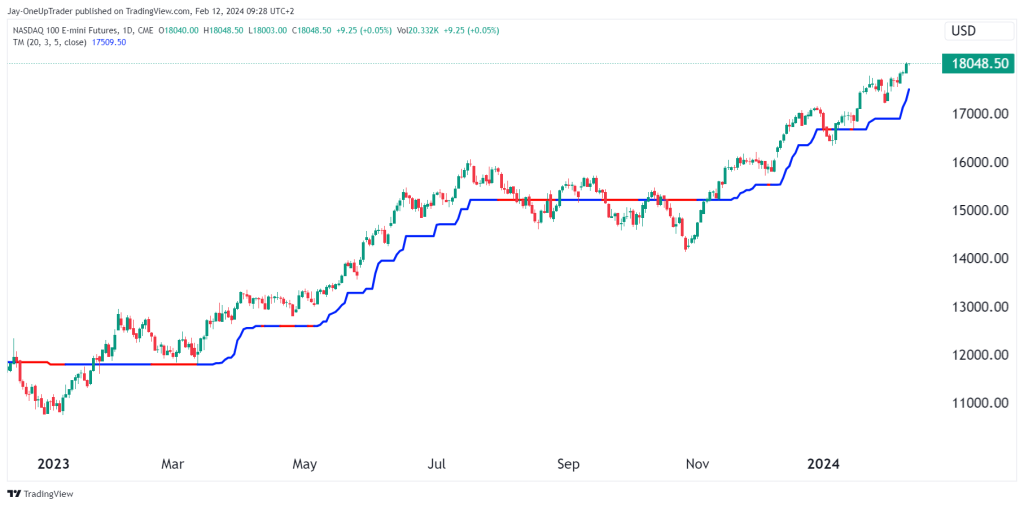
Day traders need indicators that can provide quick insights due to the short-term nature of their trades. The Trend Magic indicator is one not many know about but is far more powerful than moving averages, in my opinion. The indicator turns blue when price is above it and red when price is below it. Traders can employ the rule of taking longs only above the line and taking short only when price is below the line. You will find that when you use the trend magic indicator, when it shifts colors thus indicating a change in trend, there is usually a pullback that occurs when price comes back and tests the line before continuing to move. Look at that as a possible strategy for trend trading.
Gaussian Channel:
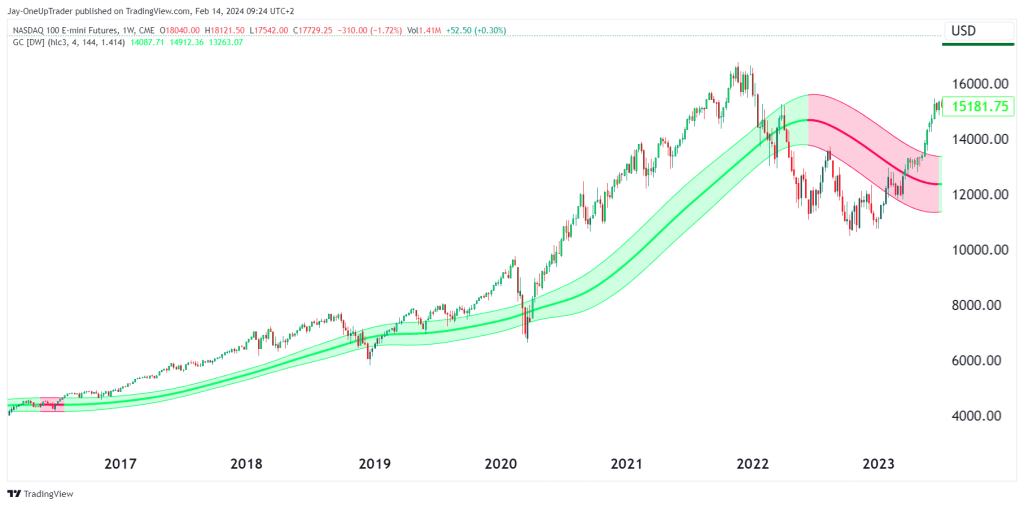
The Gaussian Channel is a tool that uses statistical methods to find potential price reversals and trends in the market. The indicator consists of three lines: the upper Gaussian Channel, the lower Gaussian Channel, and the middle line. The upper and lower channels are calculated based on the standard deviation of the price from the middle line.
The middle line represents the moving average of the price over a specified period, usually 20 or 50 periods. The upper and lower channels are calculated by adding or subtracting a multiple of the standard deviation from the middle line.
How To Trade This Trend Indicator
I find the best way to use the Gaussian channel is to identify long-term trends and use them in our short-term strategies. We can also use the channel to enter trades once the price retraces into the zone. Just keep in mind that the indicator is very ‘lagging’, which is why it can be used more effectively for long-term trades and outlooks. There may be strategies that are primarily based on using the Gaussian channel for trades, but in my opinion, it’s best used to understand the long-term trend, as already mentioned.
Developing a Robust Trend Trading Strategy
Just like any method of trading, having a robust strategy is essential. Trend trading is no different. A well-crafted strategy and trading plan must be developed in order to have a true chance of success. Here, we delve into the key components of a successful trend trading strategy.
- Understanding the Market Context: The first step in developing a trend trading strategy is to understand the market context. This involves analyzing market conditions, economic indicators, and global events that could impact market trends. A thorough analysis helps in identifying the most lucrative trends to follow. Use a list and go through it one by one. If you are using the trend magic indicator, then begin by listing what is most important to remember when using the indicator. Know exactly how to enter and how to exit so you are not making trades based on emotions.
- Selecting the Right Indicators: The choice of indicators is crucial in trend trading. As discussed earlier, indicators like trend line, trend strength, and Gaussian channel provide vital insights into market movements. Select indicators that align with your trading style and objectives. For instance, if you prefer short-term trades, indicators that provide quick signals like the MACD might be more appropriate, while Trend magic would be better suited to long-term plays.
- Understand Technical Analysis: You must understand how markets move and how trends form. You must be able to spot trends objectively without subjectively looking for trades and setups. You should see the chart for what it is and keep it factual. For example, if you see higher highs form and higher lows too, then mark them off and take note that there is an uptrend. If you remain objective like this, you will stay far away from making emotional decisions.
Trend Trading Strategies
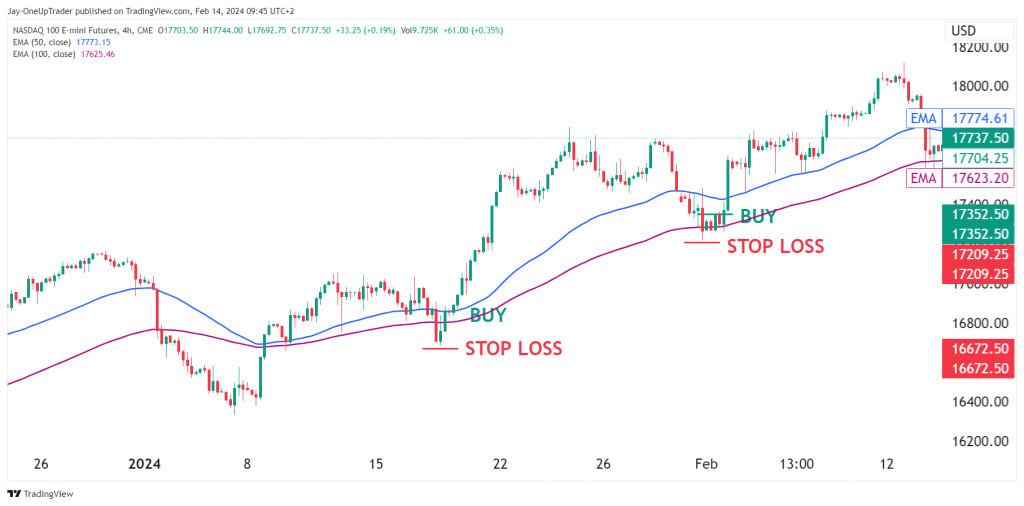
Moving average pullback:
This simple strategy uses trends and pullbacks to take entries. I put the 50 and 100 moving averages on the chart and waited for pullbacks into the zone to buy. Once the pullback occurs, wait for a candlestick reversal to take the entry and set a target at the previous high or hold for a bigger move.
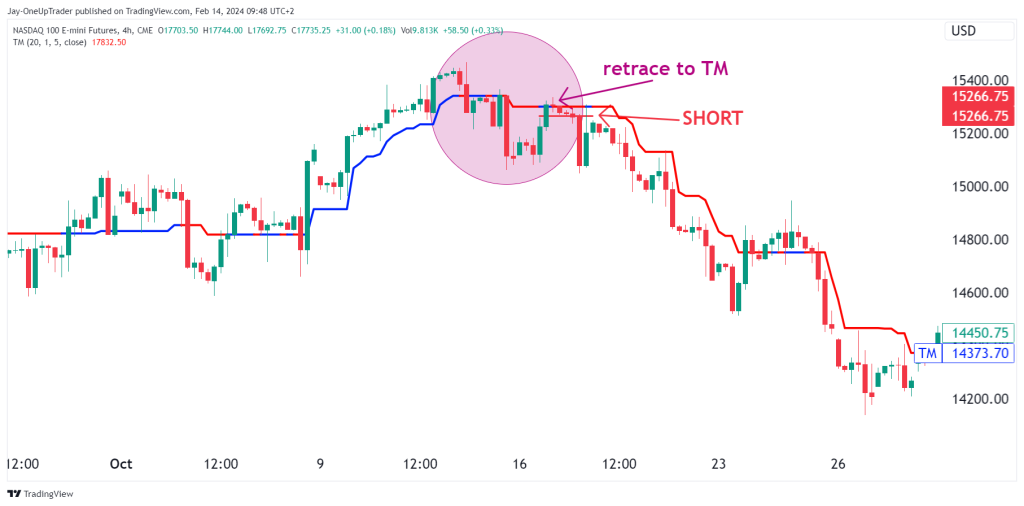
The Trend Magic Trend Indicator
Once the TM indicator turns, wait for a retracement to the line and wait for a candlestick reversal. Simply enter the trade and place the stop above the level or below it, depending on whether it’s a short or a long. Exits can be taken once the TM turns again.
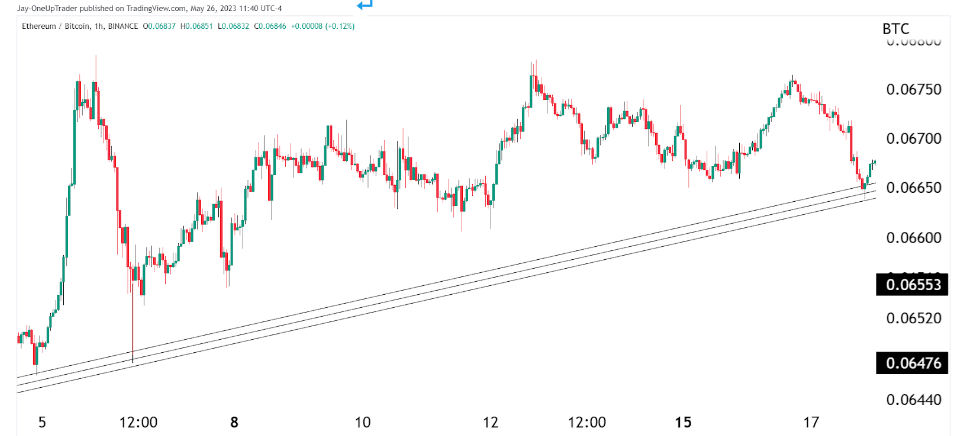
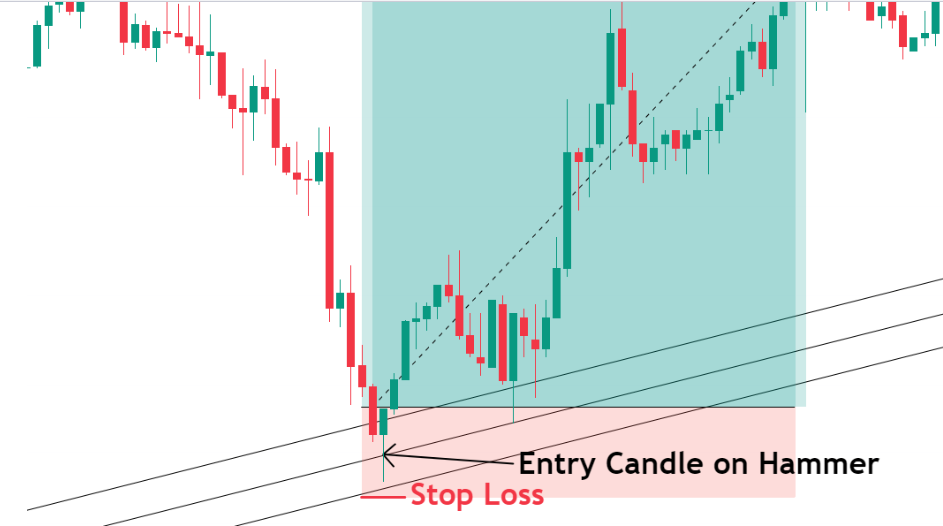
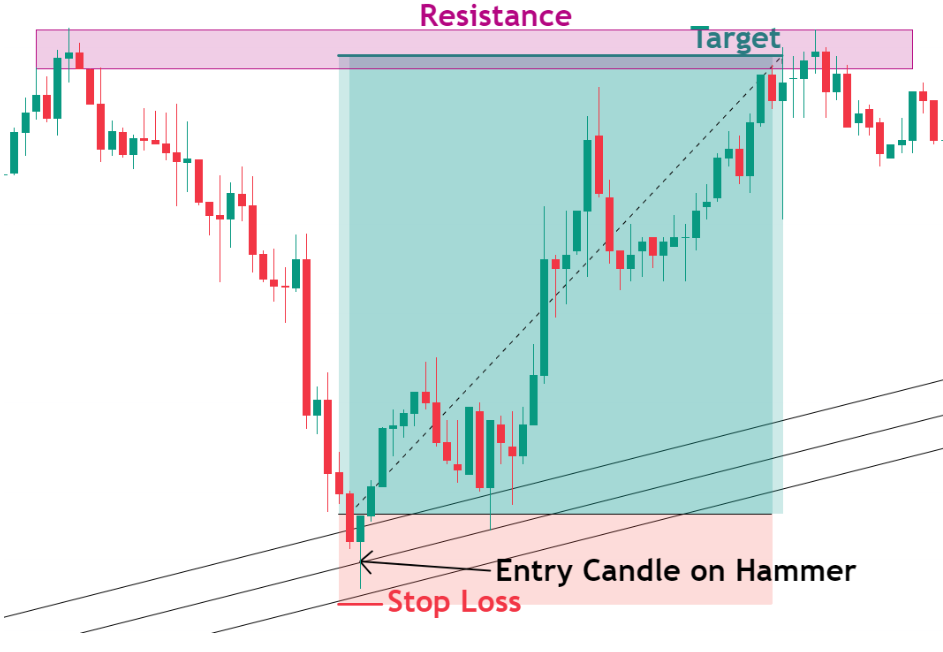
Trend Line Entry
The trend line entry is a simple one, but I am going to show you a way you can improve the entries. When you draw the trend lines, instead of just drawing one and hoping it will be accurate on a retest. Draw three and enter inside the zone like in the chart below.
Trading the Trend
Trading the trend refers to a rules-based strategy that aims to enter and exit trades in the direction of the prevailing trend. Trend traders seek to capture the bulk of price moves by capitalizing on high probability trades with the existing trend. There are several aspects to effectively trading with the trend.
Identifying the Trend
Trend identification is critical, with moving averages (MAs), trendlines, and the Average Directional Index (ADX) being among the primary tools used. Moving averages help smooth out price data to clearly reveal the direction of the trend. The Golden Cross and Death Cross, involving the crossing of short-term and long-term MAs, signal bullish and bearish trends, respectively. Trendlines connect price points on a chart, highlighting the trend’s slope and direction, serving as a guide for identifying trading opportunities.
Entering on Retracements
Entering trades during pullbacks in a strong trend allows for a favorable risk/reward ratio, as these retracements offer lower entry points in an ongoing trend. Tools such as Fibonacci retracement levels are instrumental in identifying potential reversal points during pullbacks, providing precise entry points for trend traders.
Use of Stops to Define Risk
Placing stop-loss orders judiciously is crucial in trend trading to manage risk. Stops are typically set below key swing points in an uptrend and above them in a downtrend, allowing traders to protect capital while giving trades enough room to breathe.
Managing the Trade and Exiting
Effective trade management involves staying in the trade as long as the trend persists and using trailing stops, moving averages, or trendlines to lock in profits. Exit strategies should be predefined, with indicators like a flattening trendline, moving average crossovers, or a downturn in the ADX signaling potential trend exhaustion.
Counter Trend Trading
Counter-trend trading can be executed across any market and timeframe, appealing particularly to swing traders who aim to profit from short-term price movements against the broader trend. The strategy is based on the principle that markets do not move in a straight line and that price corrections or reversals are common. Thus, counter-trend traders look for overextended trends or signs of weakening momentum as opportunities to enter the market.
Effective counter-trend trading involves the use of various technical indicators to spot high-probability reversal points. Among the most valuable tools are the Relative Strength Index (RSI) and the Stochastic Oscillator, which help identify overbought or oversold conditions. Additionally, Bollinger Bands can signal potential reversals when price touches or crosses the outer bands. These indicators, combined with candlestick patterns and trading ranges, provide a structured way to approach counter-trend trading.
Ending Off
Trend trading offers traders a structured way to capitalize on market movements in the direction of the trend. By using key indicators like moving averages, channels, and oscillators to identify and trade high-probability setups, trend traders can capture the bulk of trending moves efficiently. Additionally, strategies like using retracements, trading ranges, and candlestick patterns allow for solid entries with predefined risk parameters.
Remember to be clear on your strategy and know what you want from trading. Don’t trade with emotions, and do everything you can to stay aware from them.
