

Introduction
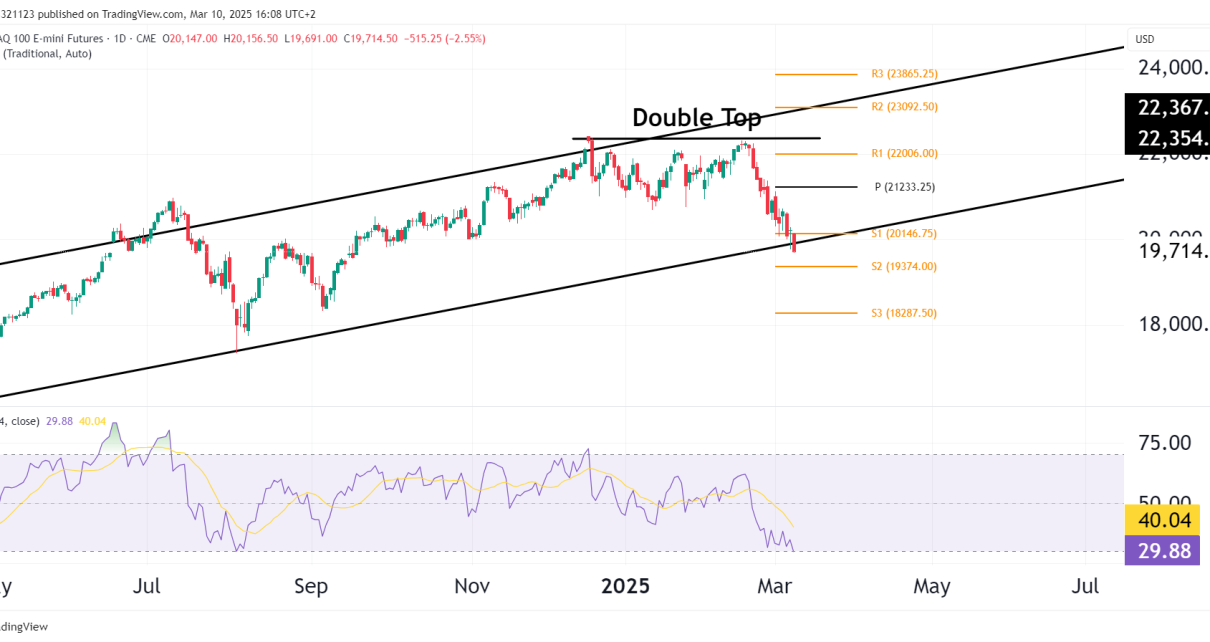
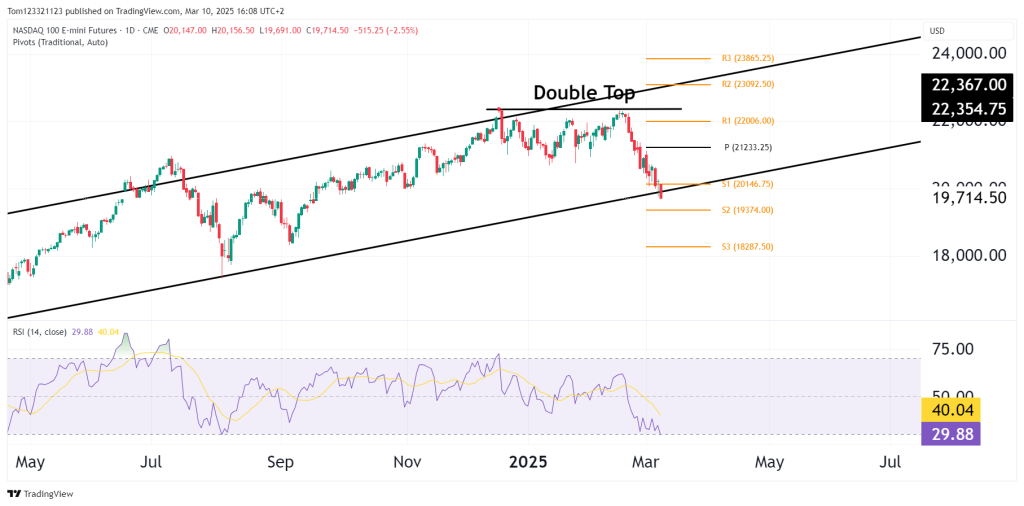
The NASDAQ 100 (NQ) futures have fallen sharply since the middle of February. The recent sell-off was triggered by a double top pattern near 22,367.00, pushing the index to test the lower boundary of its long-term ascending channel. With the market now sitting at a key support level, the next move will likely set the tone for the medium-term trend.
Technical Analysis
1. Double Top Reversal Signals Bearish Momentum
- The double top pattern formed at 22,367.00 has played out, with the price action confirming a reversal.
- The break below the pivot at 21,233.25 intensified selling pressure, with the market heading straight to S1 (20,146.75).
2. Testing Long-Term Channel Support
- The NQ futures are now testing the ascending channel’s lower boundary, a critical level for maintaining the upward trend structure.
- A break below this channel would mark a significant bearish shift if prices remain below that.
3. Momentum and RSI Analysis
- The RSI is at 30.51, which is oversold and could lead to a short-term relief rally.
- However, the lack of bullish divergence in the RSI means that the downtrend remains intact, and any bounce might be short-lived.
Support and Resistance Zones
Support Levels:
- S1 (20,146.75): Key support at the channel boundary.
- S2 (19,374.00): If S1 fails, this level offers the next line of defense.
- S3 (18,287.50): Aligns with the 2024 summer lows, a significant support level if the sell-off continues.
Resistance Levels:
- 21,233.25 (Pivot): The first hurdle for any relief rally.
- 22,006.00 (R1): Strong resistance from a previous support area.
- 22,367.00 (Double Top): A major barrier, and a recovery above this level would invalidate the bearish pattern.
Potential Market Scenarios
Bullish Scenario
- If the channel support holds, a bounce towards the pivot at 21,233.25 is probable.
- Clearing this level would reduce selling pressure, opening the door to 22,006.00.
Bearish Scenario
- A clear break below the channel would likely accelerate losses to S2 (19,374.00) and potentially S3 (18,287.50).
- The oversold RSI could limit downside in the short term, but any weak bounce would likely face strong resistance.
Outlook Summary
- Short-Term (1-2 Weeks): Bearish bias, with a potential short-covering rally if support holds.
- Medium-Term (1-3 Months): Dependent on whether the ascending channel remains intact.
- Long-Term (6+ Months): The uptrend structure is still valid, but a channel breakdown would signal a major trend shift.
