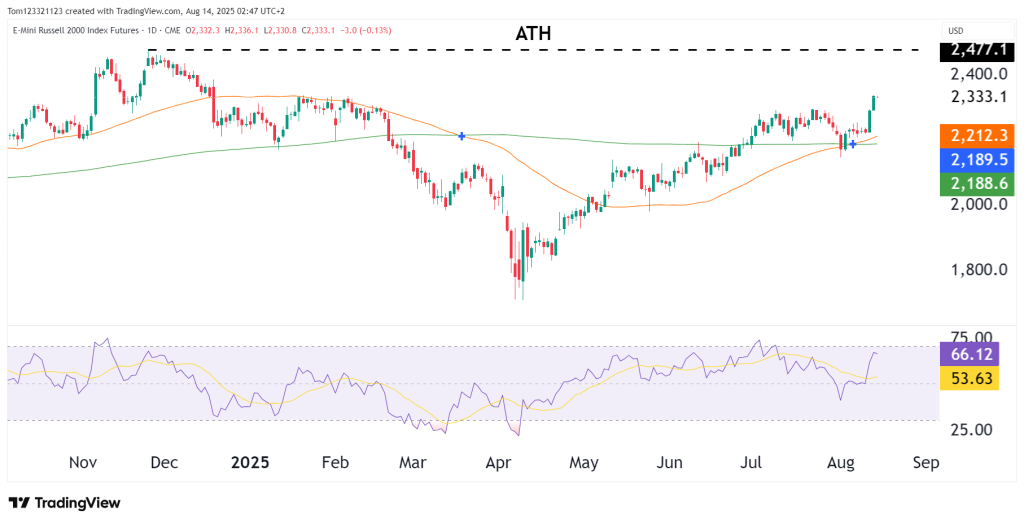
The Russell 2000 futures have surged in the past two trading sessions, up 5% marking its best two days since the 5th of November 2025. This was on the back of a positive CPI report that showed inflation is in line with expectations. The price broke decisively above the 50-day and 200-day moving averages after a prolonged sideways range. This is a very bullish sign for the index.
The breakout rally over the past week has been sharp, leaving price extended in the short term.
The next major resistance lies at the all-time high zone around 2,477, meaning there’s still room to the upside before a key decision point.
The Russell’s relative strength vs. other U.S. indices means that there is small-cap participation in the broader rally.
Momentum & Indicators
RSI at 66.12 is nearing overbought but not yet flashing an extreme warning.
The rally has been fast, so a minor pullback toward 2,300 would be healthy before another leg higher.
Introduction The E-mini Russell 2000 Index Futures (RTY) continues to follow the major indices upward be it at a slower pace, but price action has started to consolidate just below resistance near 2,535.2 (R1 pivot). Small-cap stocks have shown impressive resilience in recent sessions, holding above support zones and maintaining bullish momentum. Technical Overview On Read More…
Introduction Gold Futures (GC) are still performing well in 2024, up 14.2% YTD and 22% for the past 365 days. The main observations we can look at is the huge divergence between the 50 and 200 SMA. The 200 is steadily rising so long term investments and trades point bullish. At the moment, GC is Read More…
introduction Euro FX Futures (6E) have surged lately as the Dollar strength diminishes. The recent move is supported by both technical strength and fundamental catalysts, with the euro gaining momentum against the dollar. As of today, Euro futures are trading at 1.07090, up +0.95%, showing a strong bullish breakout above the 1.06305 resistance level. The Read More…