

Introduction
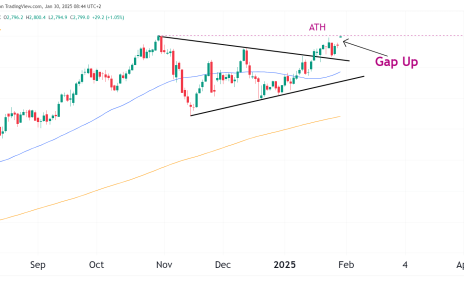
Nasdaq 100 E-mini Futures (NQ) have pulled back from recent highs after failing to sustain a breakout attempt above all-time highs. Following a strong multi-month rally, price is now rotating lower toward support, marking a shift from momentum expansion into consolidation.
From here, the first support will be the 50 moving average, which also aligns with the pivot point. At the moment, this is not a significant pullback and could be seen as a potential zone for buyers to accumulate positions.
Market Summary
Primary trend: Bullish on a higher-timeframe basis, with the long-term uptrend still intact.
Current market regime: Pullback within an uptrend. Momentum has cooled after rejection near all-time highs.
Key support (line in the sand): The 50-day moving average and pivot support near 25,400–25,500.
Bias-defining level: Holding above the 50-day MA keeps the bullish structure intact. A sustained move back above 26,000 would strengthen the upside case.
Risk to the thesis: Failure to hold the 50-day MA increases the risk of a deeper retracement toward lower support zones.
Why This Matters Right Now
NQ is pulling back while the broader market sits at key turning points. The S&P 500 is moving sideways near record highs. Gold is pushing into new highs. Crude oil is trying to stabilize after bouncing from long-term support.
For growth-focused markets like the Nasdaq, pullbacks near highs are a test. How price acts during these pauses shows whether the uptrend is still strong or starting to weaken.
If the pullback stays shallow and finds support, it suggests buyers are still in control. If support breaks, it may signal that the rally is losing strength.
Market Structure & Trend
Daily chart

Daily chart Nasdaq 100 Futures technical analysis
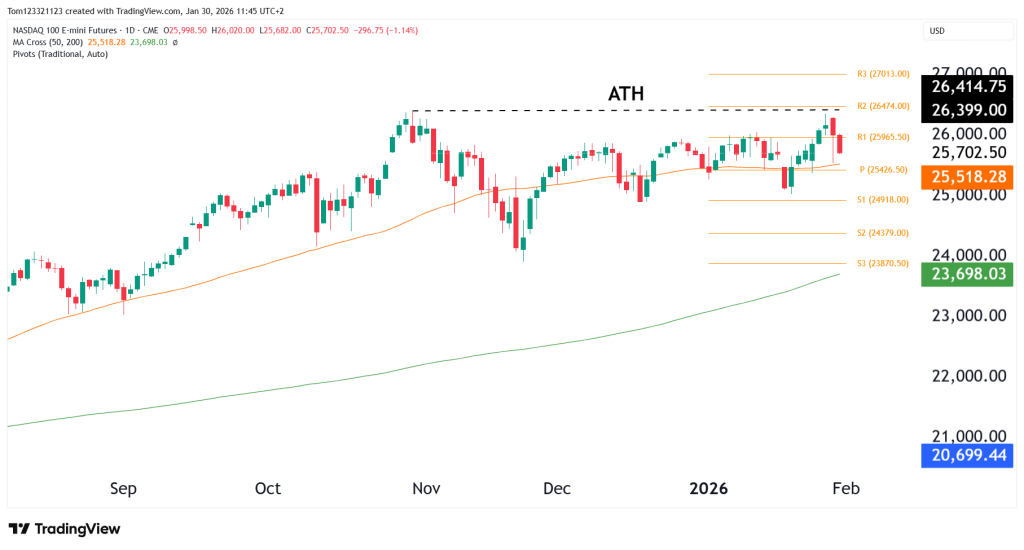
On the daily chart, NQ was rejected near its all-time high and has pulled back toward the rising 50-day moving average. This average has repeatedly acted as support during the uptrend, so it’s an important level to watch.
So far, the pullback looks controlled. There’s no sign of panic selling or major technical damage. Price bars are overlapping instead of expanding, which points to consolidation, not distribution.
The 50-day moving average also lines up with the daily pivot area around 25,400–25,500. Holding above this zone would keep the bullish structure intact and leave room for another push higher.
Weekly chart
Weekly chart Nasdaq 100 Futures technical analysis
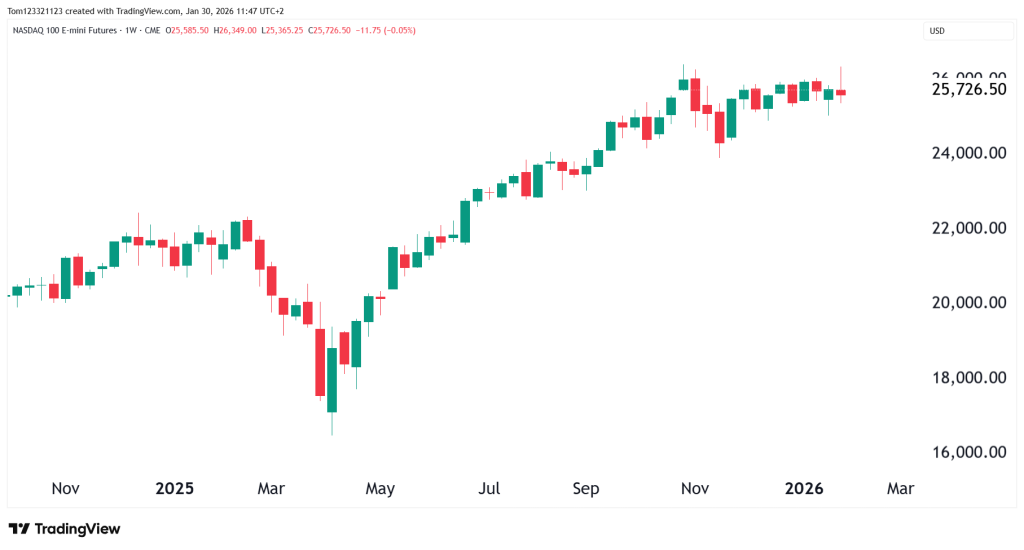
Looking at the bigger picture, the weekly chart still looks healthy. Price is holding well above earlier breakout levels and hasn’t broken any major weekly support.
Recent candles show consolidation after a strong move higher, not a reversal. Momentum has slowed, but there’s no clear bearish pattern on the weekly chart.
As long as NQ stays above prior range highs and keeps its trend structure, the longer-term uptrend remains intact.
Key Technical Levels
Line in the Sand
- 25,400–25,500: Confluence of the 50-day MA and daily pivot support. Holding above this zone keeps the pullback corrective.
Bias-Defining Levels
- 26,000: Reclaiming this level would shift momentum back in favor of the bulls and reopen upside potential.
- 25,950–26,050: Prior resistance zone near recent highs. Acceptance above this area strengthens the breakout case.
Extension / Reference Levels
- 26,400–26,500: All-time high zone. A clean break and hold above this area would resume price discovery.
- 24,900–25,000: Next major downside reference if the 50-day MA fails.
Looking Forward: Scenarios
Bullish Continuation (40%)
NQ holds the 50-day MA, stabilizes, and makes another attempt to break above the all-time high zone near 26,400.
Sideways Consolidation (35%)
Price chops between 25,400 and 26,000 as the market digests gains and resets momentum.
Deeper Pullback (25%)
A break below the 50-day MA opens the door for a retracement toward the 25,000 area while maintaining the broader uptrend.
Bottom Line
Nasdaq 100 futures are pulling back after setting record highs, but the larger trend hasn’t changed. The move lower looks like a normal pause after a strong rally, not the start of a sharp selloff. Momentum has cooled, but the structure of the trend is still in place.
The key level to watch is the 50-day moving average. This area has acted as support throughout the advance and will likely decide whether buyers step back in. Holding above it would suggest that bulls are still in control and that this pullback is simply resetting conditions for another push higher.
If price breaks below that support, it wouldn’t mean the bull market is over. However, it would signal that the market needs more time to work off excess optimism. In that case, a deeper pullback or longer period of consolidation would be likely before the next sustained move higher.
This analysis is for educational and informational purposes only and does not constitute trading advice or a recommendation to buy or sell any futures contracts. Futures trading involves significant risk and may not be suitable for all investors. Always conduct your own research and consult with a licensed financial professional before making trading decisions.
