

Understanding the Recent Surge in NASDAQ and US Equity Markets
Over the past week, the NASDAQ and other US equity markets have surged. This rally can be attributed to favorable economic data, strong corporate earnings, historical market patterns, and legislative support.
One of the primary drivers behind the market’s recent strength is the softer inflation data. The continued decline in inflationary pressures has raised hopes that the Federal Reserve may soon pivot from its tightening cycle, leading to interest rate cuts later in the year.
Another significant factor is the substantial amount of cash reserves waiting on the sidelines. With over $6 trillion in cash, there is ample liquidity ready to be deployed into the markets. Additionally, the current low levels of margin debt suggest that investors have not yet fully leveraged their positions, indicating room for increased investment activity as confidence grows (markets.businessinsider.com).
Trend Analysis
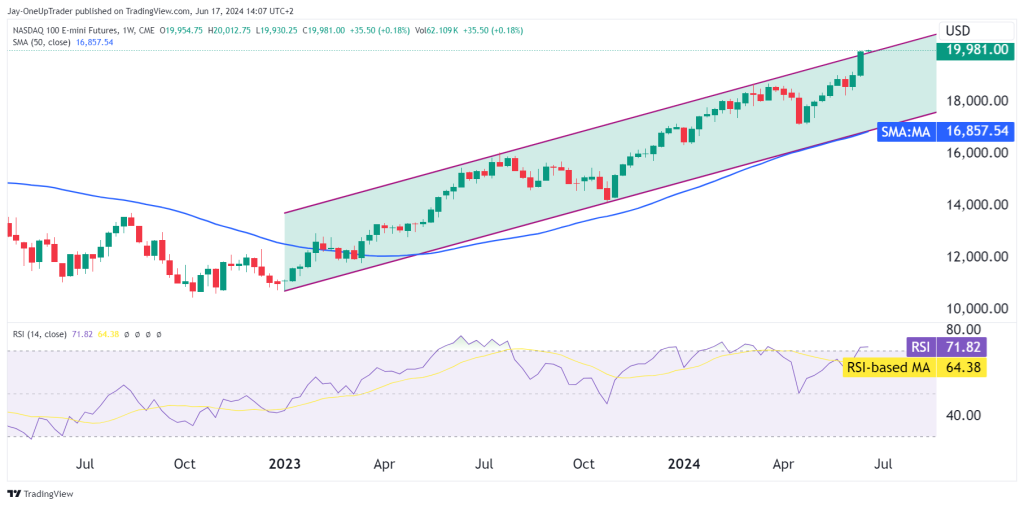
The trend for NQ is within a strong bullish channel, marked by higher highs and higher lows. This channel, highlighted in green, has been a consistent indicator of the market’s upward momentum since the start of 2023. As long as price remains within this channel, we can expect the price to continue to rise.
Relative Strength Index (RSI)
The RSI is a crucial momentum indicator used to assess whether an asset is overbought or oversold. The current RSI value is 71.80, with an RSI-based Moving Average of 64.38. An RSI above 70 typically indicates overbought conditions, suggesting that the market may be due for a correction or consolidation. Because of this, we should probably avoid taking longs right now and wait for a pullback on a shorter timeframe.
Key Levels to Watch
- Resistance Level: The upper boundary of the ascending channel is a significant resistance level.
- Support Level: The 50-week SMA is a critical support level. A dip towards this moving average may present a buying opportunity if the price rebounds.
- Psychological Level: The $20,000 mark is a key psychological level.
Trade Opportunities
- Buy the Dip: If the price retraces towards the 50-week SMA and shows signs of a rebound, it could be the entry point for long positions.
- Breakout Trade: For traders looking to capitalize on momentum, a breakout above the $20,000 resistance level with strong volume confirmation could be an ideal entry point. In this scenario, the next target would be the extension of the current bullish channel.
- Overbought Conditions: Given the RSI is above 70, it is essential to watch for signs of a reversal or consolidation. Traders could consider taking profits on long positions or employing trailing stops to protect gains.
Ending Off
At the moment, taking shorts in NQ is a risky game. The trend is well established and the fundamentals support it too. Waiting for pullbacks to take long positions could be the way forward as buying while the RSI is heavily overbought might mean buying at higher prices now as prices may retrace in the short term.
