- Bullish trend channel is broken, triggering stop losses for longs.
- Healthy correction will create potential opportunities for patient traders.
- Volume profile indicates support as price falls, and Fibonacci levels are the main focus.
Technical Analysis
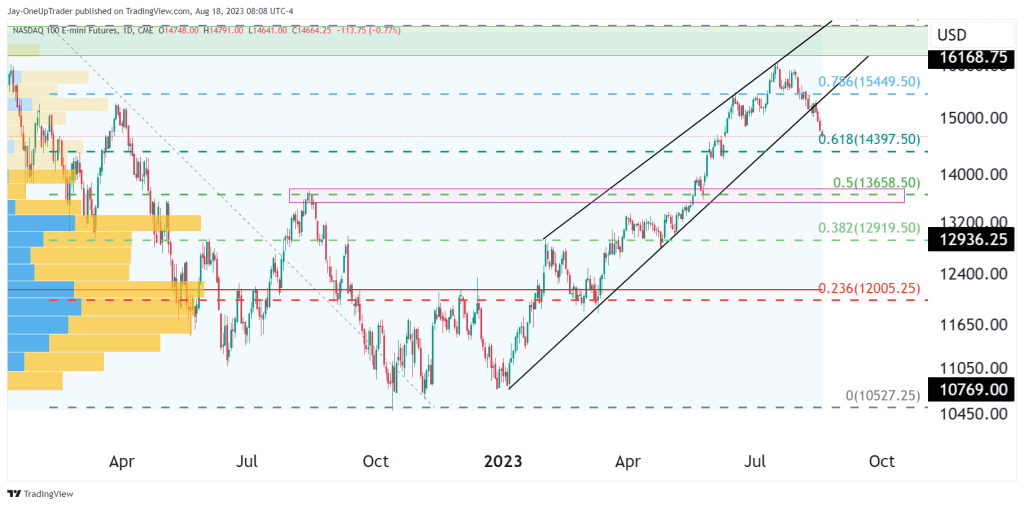
Bullish trend channel: The bullish trend channel on the daily chart has now been officially broken. There are a lot of stop losses getting triggered at this point for the traders who went long. Traders who have banked a solid profit from the near 50% rally in NQ for the past 10 months have also begun taking profits, but where will this lead us?
This is a healthy correction in my eyes, and there could be some great opportunities for the patient who wishes to take advantage of the next bull run.
One aspect of the chart that we can focus on is the volume profile. As the price falls, there is more and more liquidity meaning there should be more support. You can see this by looking on the left of the chart. The yellow bars represent volume. The longer they are, the more volume has been traded at that specific level. The point of control (POC) which is the price that had the most trading activity, is all the way down at the 23% Fib level. That is a further 16% drop from here which I personally see as an unlikely occurrence.
The Fibonacci 61% level is likely to be the first support that we see as NQ falls. That is only 2% away from current market prices. If that level does not hold, then we can look at the 50% level, which also coincides with a support zone.
There is a lot of time for us to look for long entries, and we may not get them for another week or so, but it we can keep NQ in the back of our minds and wait for for support to present itself at either of the mentioned levels.