

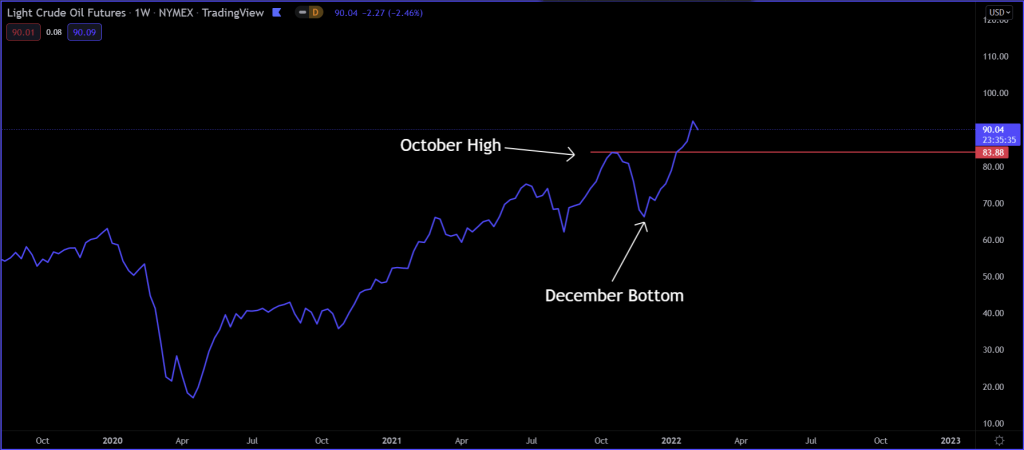
Over the last few months, rising oil prices have many market participants’ attention. The chart below shows the price of oil, which peaked at the end of October 2021 and then fell about 25%. It bottomed in early December 2021 and hasn’t looked back. Oil broke through the Oct 2021 high of $85 a barrel in January and has since reached over $90 a barrel, the highest price level of oil since September 2014. The U.S CPI (Consumer Price Index) data for January 2022 came out yesterday, breaking its 7% high set in December. Since energy holds significant weight in the CPI, it was no surprise that the CPI created another high that hasn’t been seen since 1982. If oil continues to climb higher, as it did in December and January, we can expect higher CPI prints going forward. However, despite oil’s price recent rise, the market’s inflation expectations have not given off the same impression. If oil is rising, we should expect inflation expectations to increase too, but recently, that has not been the case. So, let’s take a closer look at the two and see what’s going on.
Inflation Expectations
To understand inflation expectations, we first need to understand TIPS or Treasury Inflation-Protected Securities. TIPS are government bonds that are designed to protect an investor from inflation. When inflation expectations rise, bond yields generally rise too, which means lower bond prices. Unlike a Treasury bond, where the principal value of the bond falls if yields rise, the principal value of TIPS increases instead. So, if inflation is rising, the principal value of TIPS will rise too to offset inflation. TIPS are indexed to the CPI, implying that TIPS should also rise if the CPI is expected to rise. Since oil’s impact on gasoline heavily influences the CPI, if oil price rises, inflation expectations or TIPS should also increase to protect the investor against inflation. Interestingly since oil started rising again in early December 2021, TIPS breakeven rates have not followed suit.
The next part we need to understand is breakeven rates. The breakeven rate refers to how we can measure the actual market expectations of inflation. The breakeven rate calculation is simply the nominal yield minus the real yield (i.e., inflation-adjusted yield). So, if you take the nominal 10-year U.S. Treasury yield as an example and subtract it from the yield of the 10-year TIPS (which is the real yield adjusted for inflation), you end up with your 10-year breakeven rate. Therefore, the 10-year breakeven rate is the market pricing in what it thinks the inflation rate will be ten years from now. Now, I prefer to look at the 10-year and 5-year breakeven rates, as well as the 5-year, 5-year forward rate. The 5-y, 5-y forward rate is what the market thinks inflation will be within a 5-year period starting five years from now. The 5-year is shorter-term, whereas the 10-year and especially the 5-y, 5-y forward rate are longer-term.
In the chart below, I have depicted the 5-year (green) and 10-year (pink) breakeven rates, as well as the 5-y, 5-y forward rate (white). The 5 and 10-year peaked in November 2021, and the 5-y, 5-y peaked in October 2021. Meanwhile, the inflation rate has only gone higher since then. In October, the CPI was just over 6%, and as of January’s data, it is at 7.5%. So, why didn’t inflation expectations rise accordingly? Markets that attempt to be forward-looking are often pricing in expectations that are further out than just a few months. Therefore, the breakeven rates indicate that they knew there would be inflation (since they had been rising since March 2020) but did not expect high levels of inflation to last over the long term.
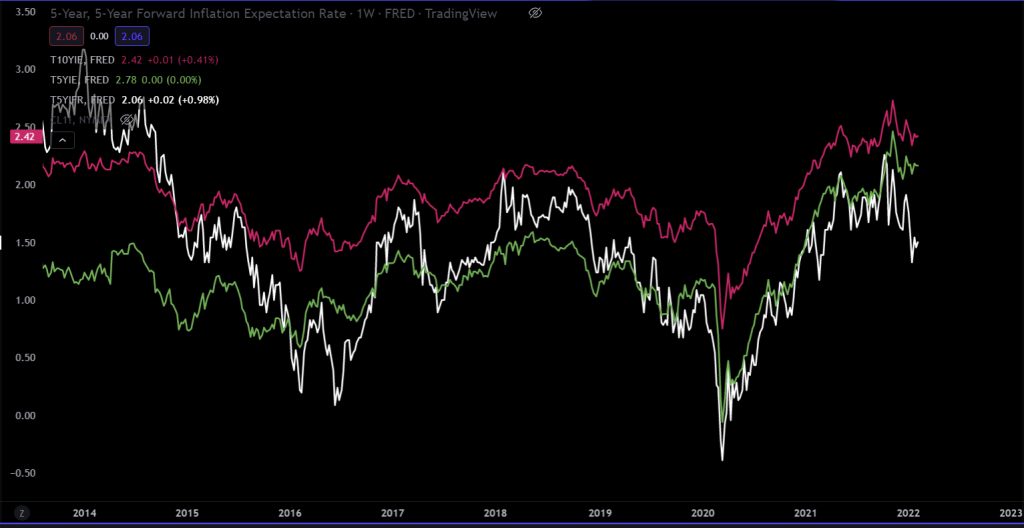
Also, the 5-year breakeven rate is at about 2.78, which is higher than the 10-year breakeven rate, which is only around 2.42! If the market expected inflation to last long-term, the 10-year breakeven rate should be above the 5-year breakeven rate. But the 5-year went above the 10-year in January 2021, saying higher inflation levels are here for the short-term but not the long-term. To confirm this, the longer-term 5-y, 5-y forward is not only below the 5-year breakeven rate but also below the 10-year as well, sitting at just 2.06. This is not what we would expect if inflation and oil prices keep rising over the long haul. Now, this information is counter to what the oil market is saying.
Oil and Inflation Expectations
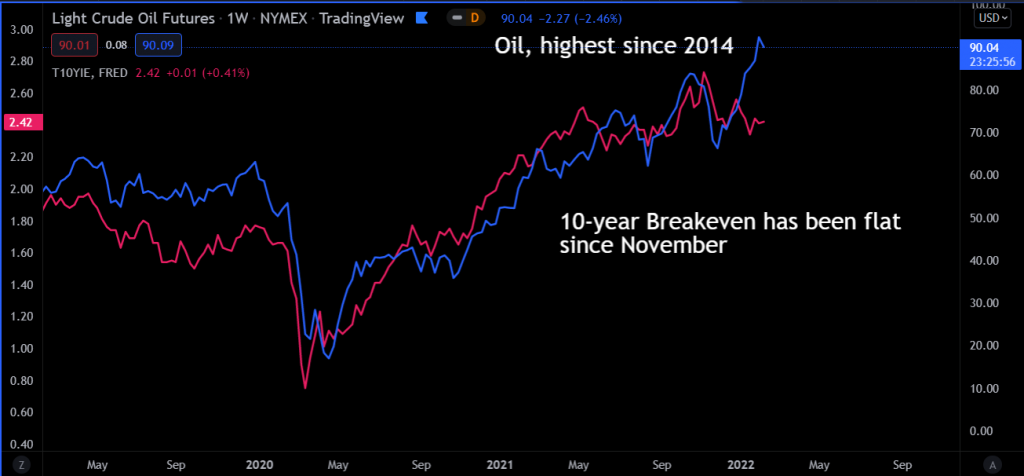
Look below at a chart of oil (blue) alongside the 10-year breakeven rate (just using one rate to make it easy on the eyes). In October 2021, the Oil price began to fall a few weeks before the 10-year breakeven rate peaked. Then a couple of weeks later, it bottomed out, eventually making a new high while the breakeven rate went flat. If you remember from the chart above, the 5-year breakeven has also gone flat, and the 5-y, 5-y (longer-term inflation rate) has broken to the downside. Now, it is not uncommon for correlations to break down from time to time. But when they do, they often present a trading opportunity. Now, you can go back and look at these breakeven rates and oil and see the correlation breakdown for weeks or even a few months at a time. But the last time the divergence persisted was back in 2007-08.
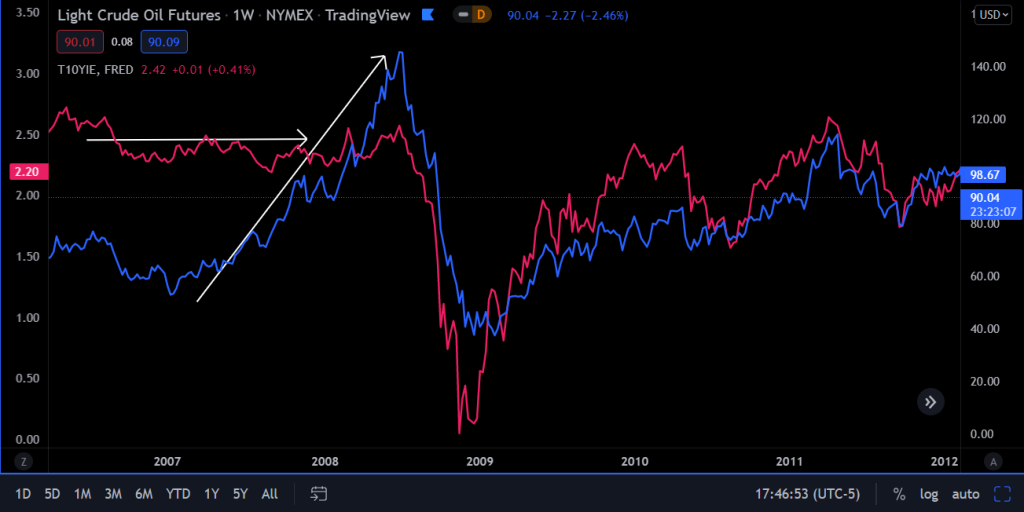
Below are oil and the 10-year breakeven rate charts back around 2007-08. You can clearly see the divergence – flat breakeven rate and rising oil price. If we look from January 2007 – to June 2008, oil’s price had a sharp increase of over 50%. Also, during that same time period, the CPI went from 2% up to 5.5%. That should have sent inflation expectations through the roof, but it didn’t. The market was telling us that yes, oil and inflation are rising now, but it will not persist. Sure enough, from June 2008 until July 2009, the CPI crashed from 5.5% to almost -2.0%. And from June 2008 until February of 2009, oil prices crashed nearly 80%, from about $148 a barrel down to just $33 a barrel! Now, does this mean that oil is going to crash since there is currently a divergence between oil and breakeven rates? Of course not, but if the divergence persists, it is something to watch out for because it could mean a big correction is coming for oil.
How Traders Can Benefit
If you are an oil futures trader, you should be paying attention to this development because you can use it to your advantage. When the breakeven rates start to move back to the upside, this could be used to confirm buying oil futures. And if breakeven rates stay flat or even begin to move to the downside like the 5-y, 5-y forward rate has, this will tell you to look for shorting opportunities in oil futures. Now, like with any correlation or indicator, you never want to use it by itself; you always want further confirmations. Therefore, I believe traders have an edge over investors. Whether you look at supply/demand, support/resistance, price action, etc., you could use this as part of your confirmation. It can also be used along with other indicators, like market sentiment. For instance, if breakeven rates start to rise, you will look for pullbacks to demand or support areas on the price chart to go long oil. And if breakeven rates start to fall, you will look for supply or resistance levels to short oil back in line with breakeven rates. Just be aware that these divergences can last for an extended period as they did in 2007-08. But, when the correlation of breakeven rates and oil show that they want to reestablish their positive relationship, it can make for good confirmation on your trading decision.
Conclusion
Oil price and breakeven rates usually have a positive relationship with one another. As Oil prices move higher, so will inflation expectations and vice versa. That correlation has broken down over the last few months. The longer the divergence persists, the stronger the case for a large oil price correction. As an oil trader, you should look for the times when oil and breakeven rates reestablish their positive correlation, whether to the downside or upside. The reestablishment of the correlation can make for a quality edge when trading oil futures.
