


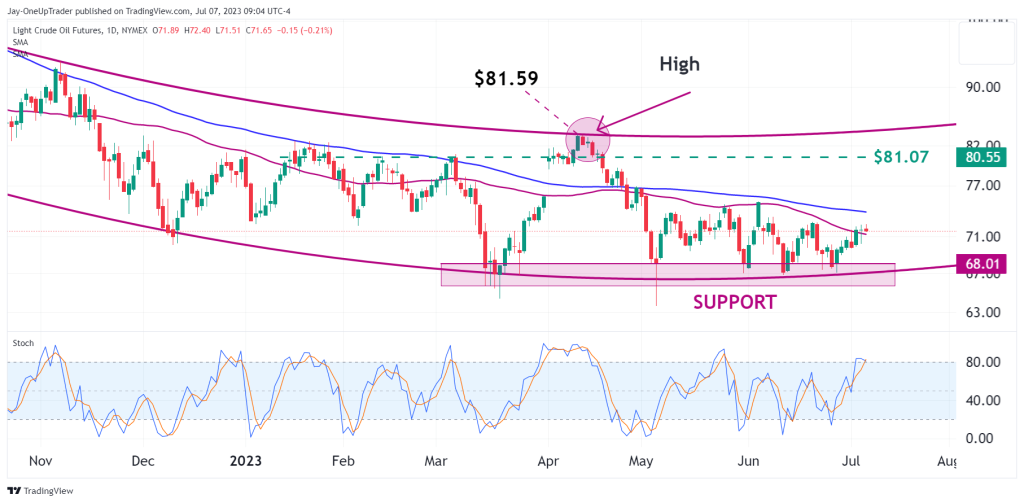
- Parabolic curve provides ongoing support on the CL daily chart, indicating a potential upward trend.
- Strong support zone at $68 formed in March, exhibiting a triple bottom pattern and attracting buying interest.
- Moving averages show a bearish signal, with the 50 moving average positioned below the 100 moving average, indicating higher selling pressure than buying. Stochastic indicator suggests overbought conditions, potentially hinting at an upcoming price decline.
Technical analysis
Parabolic curve: There is continued support at the parabolic curve on the CL daily chart. We are now moving into a phase where the curve is moving upward. We will need to wait and see if price is going to follow this pattern.
Support zone: There is a support zone at $68 which was formed in March. This zone has now formed a triple bottom. Every time price tests this level, there is an influx of buying and increased demand.
Moving Averages: The 50 moving average is below the 100 moving average. Even though CL has been consolidating, it shows there is a higher amount of selling than there is buying.
Stochastic: I do not particularly like stochastics. However, in a range-bound market like CL is currently, it can be useful to apply to the charts. It is currently overbought and could be a sign that there is a drop in price soon.
