Building on the November 25 analysis, where we saw a potential Head and Shoulders (H&S) forming, the updated chart tells a different story. The $2,542.3 “Last Support” held firm, and price action has invalidated the H&S pattern, leading to a false alarm on the formation. The bullish momentum has pushed prices back toward $2,707.6, so the upward trend channel is still in tact. Let’s analyze the updated outlook and future possibilities.

Key Developments Since November 25
H&S Invalidated – “False Alarm”
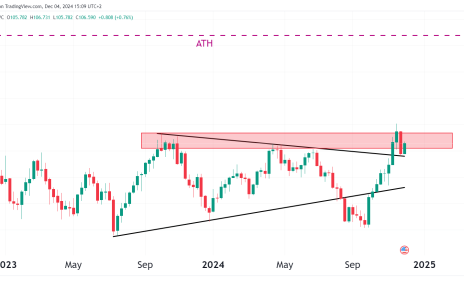
The anticipated breakdown of $2,542.3 never materialized. Instead, buyers stepped in aggressively, keeping prices above this critical support level. This invalidates the bearish H&S formation, reaffirming the dominance of the ascending channel.
Reclaiming Resistance at $2,707.6
Gold is once again testing the $2,707.6 resistance, a level that previously aligned with the “Right Shoulder” of the H&S. Successfully breaking above this level would pave the way for further upside toward the top of the channel near $2,800.
RSI Momentum
The RSI (14) has risen to 59, indicating improving momentum without reaching overbought territory. This suggests room for further price appreciation in the short term.
Why Did This Happen?
Support from the Ascending Channel
The longer-term bullish channel acted as a natural support zone, with buyers defending the lower boundary.
Macro Uncertainty & Safe-Haven Demand
Renewed geopolitical and economic uncertainties are driving demand for safe-haven assets like gold, counteracting earlier bearish pressures tied to optimism about Trump’s presidency. Perhaps the initial optimism surrounding the presidency has stalled and the sellers in Gold are lessening.
Bullish Case 📈
- Break Above $2,707.6: A close above this level could lead to a move toward $2,800, the next key resistance aligned with the upper channel boundary.
- Channel Continuation: As long as gold remains within the ascending channel, the bullish trend remains intact, with targets of $2,800 and $2,900.
Bearish Considerations ⚠️
- Rejection at $2,707.6: Another failure at this resistance could lead to a retest of $2,600.
- Loss of Momentum: While the RSI is neutral, a sharp reversal could quickly shift the sentiment.
Outlook & Summary
- Short-term (1-2 weeks): A break above $2,707.6 could target $2,800, while rejection may lead to consolidation around $2,650-$2,600.
- Medium-term (1-3 months): Sustained price action within the ascending channel keeps the broader trend bullish, with a potential move toward $2,900 if momentum persists.
- Long-term (3+ months): As long as prices hold above $2,542.3, the bullish structure remains intact, and new highs could be reached in 2025.