Introduction
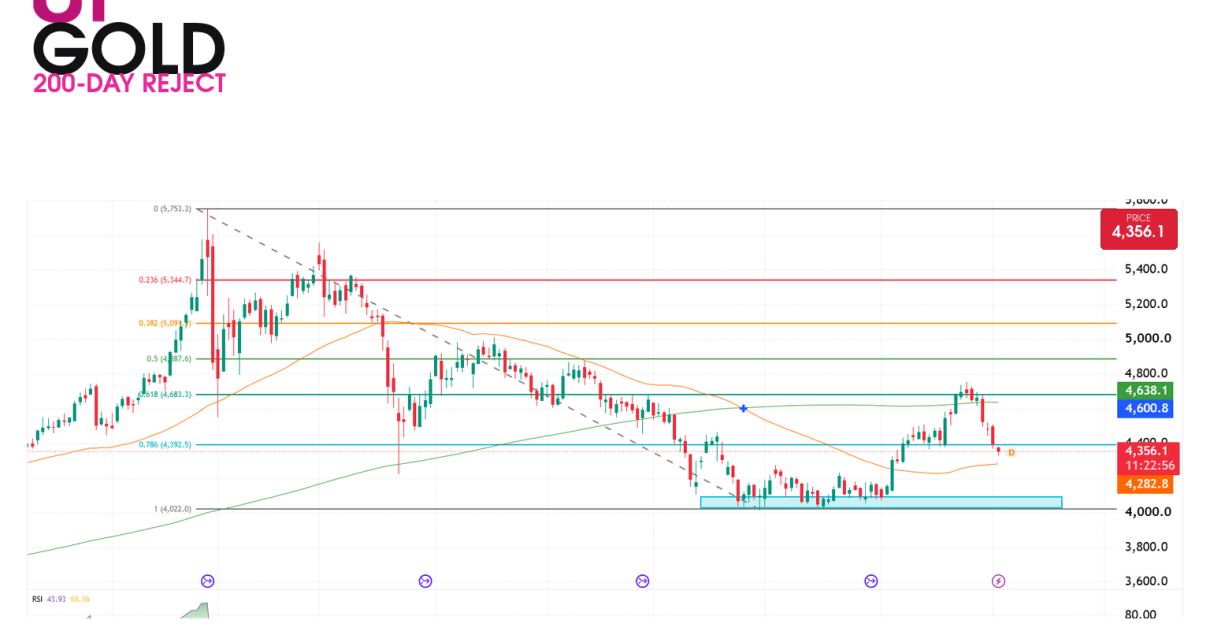
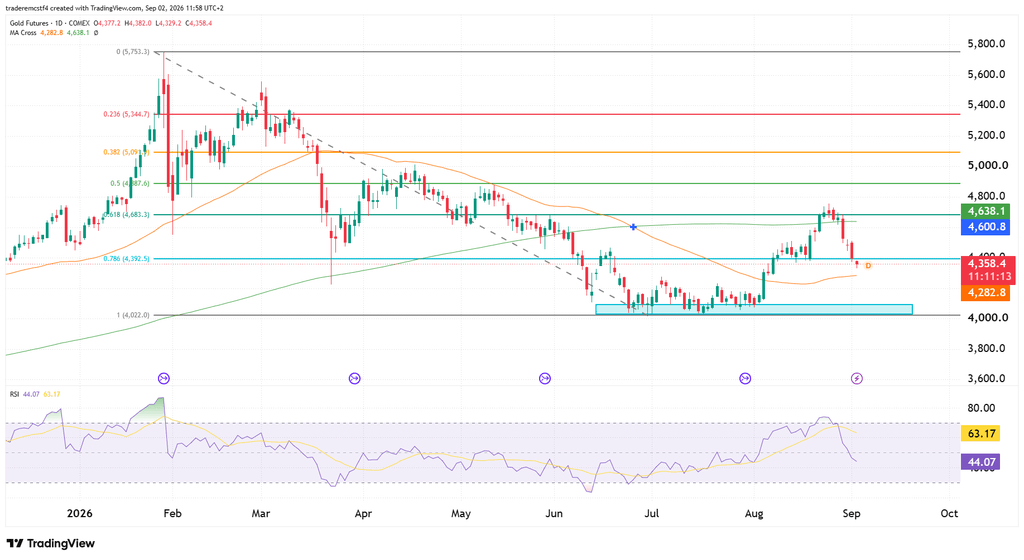
Gold futures are pulling back after a strong rally stalled at the 61.8% Fibonacci retracement (4,683) and the 200-day moving average (4,638). Those two levels were close together, and that’s where the resistance came in. On the 2 September session price is 4,356. The 78% Fib near 4,400 has given way, and the 50-day moving average at 4,282 is the next level the bulls have to defend.
Friday’s US non-farm payrolls report is the main event this week. It will move the dollar, and that can have a big effect on gold. Until that print, 4,282 / 4,400 / 4,510 is the map.
Gold Futures Trend Analysis
The 4,000 area is the support zone and the low for this year. The bounce off that floor was strong, but the rally has not followed through once it reached the 61% Fibonacci. The 200-day moving average was around the same place, so there was a lot of resistance and a lot of selling pressure from that point. From there we have a clean retracement.
Price has moved down and is approaching the 50-day moving average at 4,282. That coincides with the 78% Fib near 4,400 as the other side of the near-term band: 4,400 overhead, 4,282 underneath. RSI has come down from an overbought reading on the rally, so momentum has cooled with price.
The bulls need to show strength from here. They have to push back above 4,400 and then we need a daily close above Tuesday 1 September’s high at 4,510. If we get that close, the target is the 200-day moving average at 4,638. If they cannot, the 50-day and then the 4,000 yearly low stay in play.
Wednesday’s ADP print can move the dollar and gold ahead of the weekend, but Friday’s NFP is the one that can change everything. We are not chasing this pullback into that data.
Key Levels
| Level | Notes |
|---|---|
| 4,683 | 61.8% Fib. Rally stalled here with the 200-day. |
| 4,638 | 200-day MA. Resistance on the rally; upside target if bulls close above 4,510. |
| 4,510 | Tuesday 1 September high. Bulls need a daily close above this. |
| 4,400 | 78% Fib. Lost on the pullback; first reclaim the bulls need. |
| 4,356 | 2 September session price. |
| 4,282 | 50-day MA. Next support; price is approaching. |
| 4,000 | Yearly low / support zone. |
Possible Trades
Scenario 1: Bullish continuation
- Entry trigger: daily close above 4,510
- Stop: below 4,400
- Target: 4,638 (200-day MA)
Scenario 2: Breakdown
- Entry trigger: daily close below 4,282
- Stop: above 4,400
- Target: 4,000 yearly-low support
Scenario 3: Range / do not chase
If gold holds between the 50-day at 4,282 and the 4,400–4,510 band, we stay out of the middle. The retracement from the 61% / 200-day cluster is already in. Chasing it into Friday’s NFP is the trade we do not take. Let the close choose 4,510 or 4,282.
This analysis is provided for educational and informational purposes only and should not be considered financial or trading advice. Trading futures, forex, and other leveraged financial instruments carries a high level of risk and may not be suitable for all investors. Past performance is not indicative of future results. Before making any trading decisions, conduct your own research, assess your risk tolerance, and consult with a qualified financial advisor if necessary.