S&P 500 (ES) Weekly Chart Analysis:
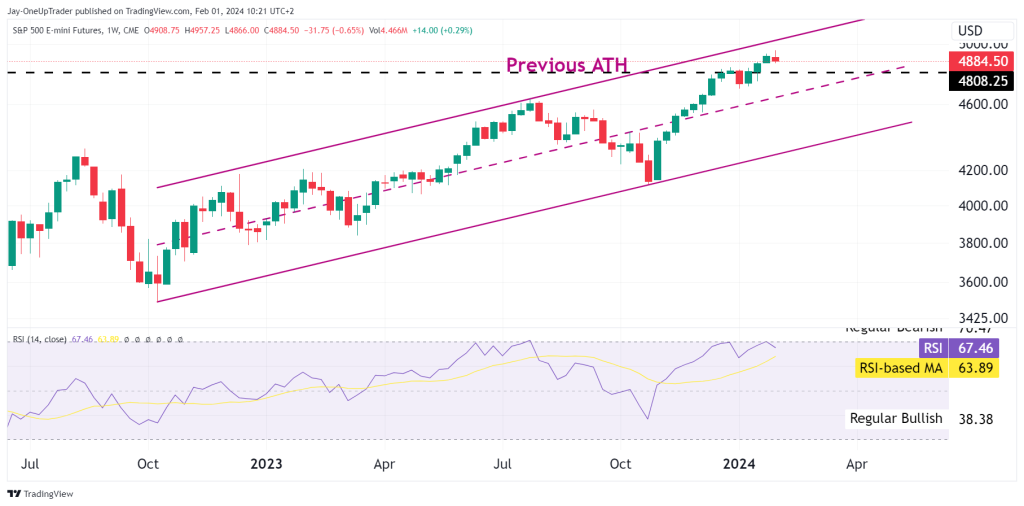
The S&P 500 E-mini Futures have demonstrated a robust uptrend, reflected in the rising channel on the weekly chart. The market recently pushed through the resistance marked by the previous all-time high, establishing a significant bullish sentiment. Current resistance sits at the upper boundary of the channel near the 4900 level.
The Relative Strength Index (RSI) is sustaining above the median line, currently positioned around 67, which aligns with bullish momentum. However, as we approach the overbought threshold of 70, we must be vigilant to not get caught chasing green candles.
Key Levels to Watch:
Resistance: The immediate ceiling to watch is the 4900 level, marking the channel’s upper limit. A convincing break above this point could signal continued bullish strength.
Support: On the downside, the channel’s lower boundary, now near 4600, serves as the primary support zone. A breach below could indicate a shift in sentiment. Unlikely with the Fed’s current stance. Support is also found at the previous all-time high.
S&P 500 (ES) Daily Chart Analysis:
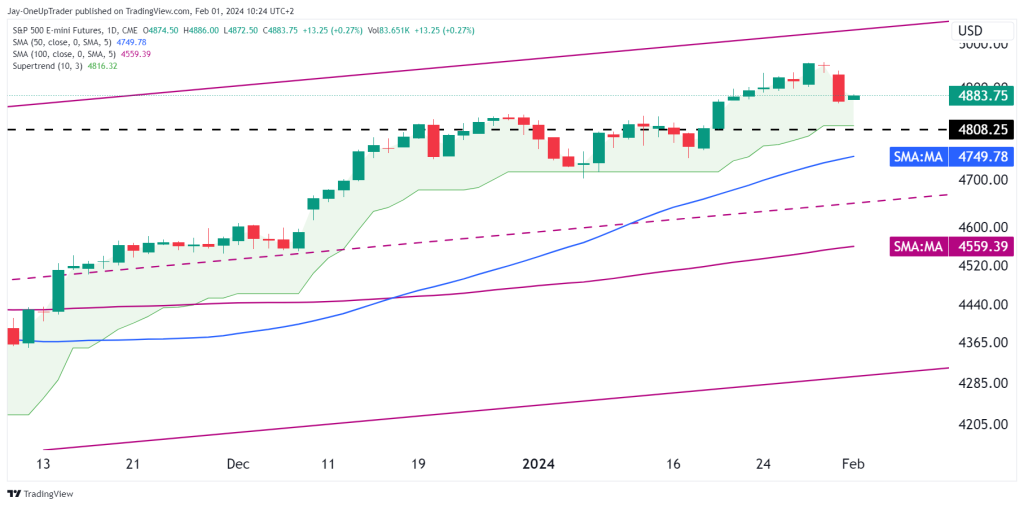
The daily chart shows the market hovering above key Simple Moving Averages (SMAs), with the 50-day SMA at 4749.78 and the 100-day SMA at 4559.39, acting as dynamic support levels. Price is still a way away from the moving averages, but they should be noted as possible levels to accumulate at. The SuperTrend indicator has remained positive since the beginning of December.
Potential Trade:
A high-probability trade setup would involve entering long positions near the SuperTrend support at 4816, with a stop-loss order placed below the 100-day SMA at 4559.39 to protect against downside risk. Targets would be set near the upper channel line around 4900, providing a favorable risk-reward ratio.
Overall Market Sentiment Rating:
Bullish
The consistent higher highs and lows on the weekly and daily charts of the S&P 500, combined with the supportive RSI readings and price action above SuperTrend and SMA indicators, clearly signal a bullish trend. We must remain cognizant of the RSI nearing overbought levels, which could prompt short-term retracements, but the prevailing trend is unmistakably upward.