- Gold trades only $50 away from all-time highs.
- Analyzing the resistance zone above $2,040.
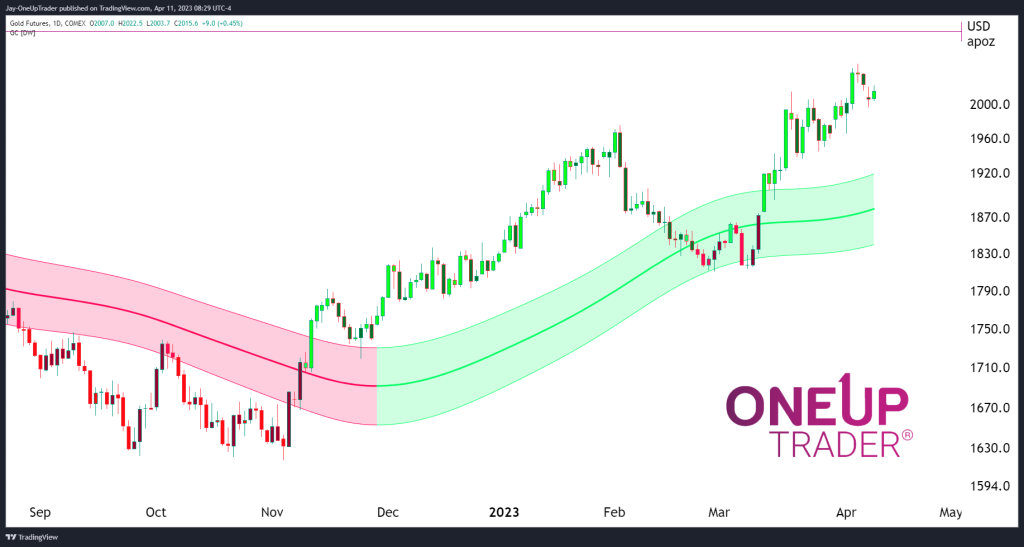
- How we can use the Gaussian channel to initiate long positions.
Gold rallies
Gold continues to surge, with all-time highs only $50 away. GC is up 11% this year as the Dollar continues to weaken and investors look for safe havens. Technical analysis points toward continued bullish momentum with little hope for bears at the moment.
This is what the chart says:
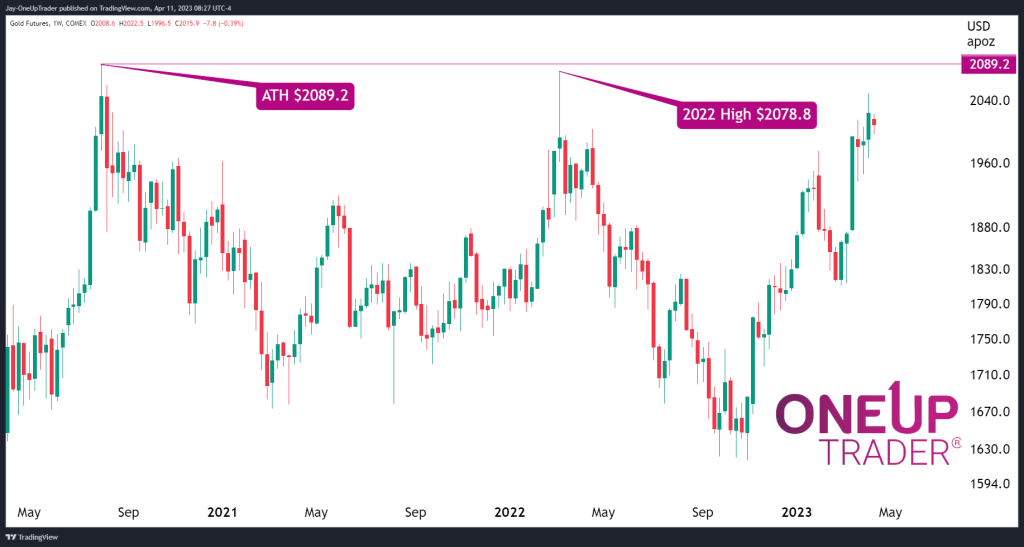
There is a fair amount of resistance above $2,040. The all-time high for Gold is $2,089.2, which was made in 2021. There was also a period of time when the price traded as high as $2,078.8 but was rejected back down to $1,670.
As Gold currently sits, we can expect some sort of resistance according to the technicals on the chart. However, with the continued weakening of the Dollar, we must be cautious in considering whether Gold will once again reject and fall. From here, it is unlikely we will see that unless there is a big shift in economic sentiment.
I have applied the Gaussian channel to the daily chart to show us the strength of the uptrend as well as the possibility of price retracing into the zone and allowing us to initiate new long positions. Any traders considering shorting GC at the moment should consider having strict money management rules in place because a print above all-time highs could create a large-scale hype event, further fueling the bullish momentum.