

S&P 500 Chart Overview
In this analysis, we’ll dive into the daily candlestick chart of the S&P 500 E-mini Futures, focusing on the technicals and chart patterns as ES bulls make a return. ES is up 5% since its low from April and the selling pressure appears to be weaking more and more.
Price Action
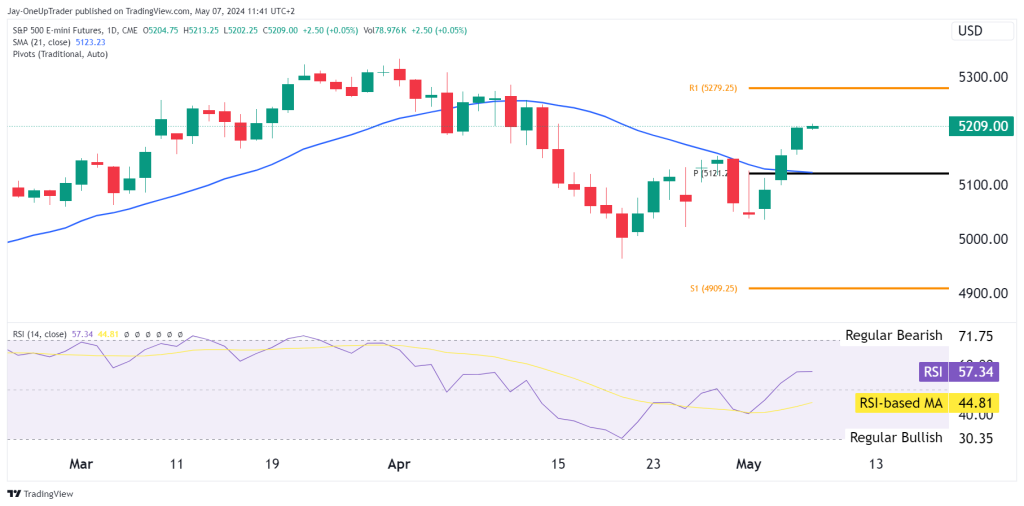
The ES daily chart shows the bulls have resurged, creating a small uptrend with the price moving above the 21-day Simple Moving Average (SMA), which we use to gauge short-term momentum. The price action above this line is something we look at for short-term momentum; basically, if the price is above it, we try to avoid short trades; if it is below it, we avoid long trades. We don’t necessarily look for buys if price action is above it for example, we still need other factors before we make that decision.
Candlestick Analysis
Three recent candles have green bodies, indicating buying pressure. Notably, the price has moved decisively above a pivot point (marked as ‘P’ at 5121.2), which often acts as a resistance-turned support level. This further solidifies our bullish stance moving forward.
S&P 500 Technical Indicators On The Daily Chart
Relative Strength Index (RSI)
The RSI is at 57.34, above the midpoint of 50 but below the overbought threshold of 70. This suggests that while there is upward momentum, it is not yet at levels that typically indicate overbought conditions. The rising RSI supports the bullish momentum seen in the price especially since it hit a low of 30 in April.
RSI-based Moving Average (MA)
This indicator, plotted at 44.81, serves as an additional gauge of momentum. It is positioned below the current RSI, confirming that current momentum is strong compared to the recent past.
S&P 500 Support and Resistance Levels
Support (S1)
The first support level is marked at 4909.25. This would be a critical level to watch if a pullback occurs but is unlikely at this point unless something severe occurs in the macro economic environment.
Resistance (R1)
The first resistance is identified at 5279.25. This level could act as a barrier to further price increases in the near term, but bulls will target this as their first major level.
Sentiment and Price Trend Forecast
Short-term Outlook (Days to Weeks)
The short-term outlook is bullish, given the recent break above the SMA and pivot point, along with supportive RSI levels. As traders, we could look for opportunities to buy on dips toward the SMA or pivot point.
Medium-term Outlook (Weeks to Months)
We maintain a cautiously bullish stance for the medium term, monitoring for sustained price action above the SMA and watching how the price interacts with the upcoming resistance at 5279.25.
Long-term Outlook (Months to Years)
More data, such as additional macroeconomic factors and market sentiment, would be necessary to provide a long-term forecast effectively. Technicals suggest that we should also be looking for longs on the long term though.
S&P 500 Strategy
Bull Case
Look for buying opportunities if the price remains above the SMA and pivot point, targeting the next resistance level. Remember that we have seen three big green candles in a row so buying pressure might be limited for the next few days. If a small pullback occurs this week, it could be the time to enter a long while targeting the all time high.