- ZB prices continue to fall after taking out a key support level.
- Explanation of why ZB falls when bond buying accelerates.
- Targets are difficult to set as there is no support level to target.
Introduction
Prices of ZB (30-year US Treasury bond futures) go down when buying of bonds accelerates due to the inverse relationship between bond prices and yields.
When demand for bonds increases, buyers compete to purchase available bonds, driving bond prices higher. However, as bond prices rise, the fixed coupon payments become less attractive relative to the higher prices, causing the bond’s yield (coupon/price) to fall. Since yields fall as prices rise, an inverse relationship forms between bond prices and yields. Furthermore, falling bond yields reduce the attractiveness for investors to hold bonds, diminishing demand. Specifically for ZB futures, prices depend on the expected future price of the underlying 30-year Treasury bond. If yields are forecasted to drop in the future due to heightened bond buying, the implied future bond price rises. As this future bond price increases, the ZB futures contract becomes less valuable, ultimately causing ZB futures prices to decline.
If we suspect that the chart will fall, we sell the ZB futures short and vice versa.
Technical Analysis
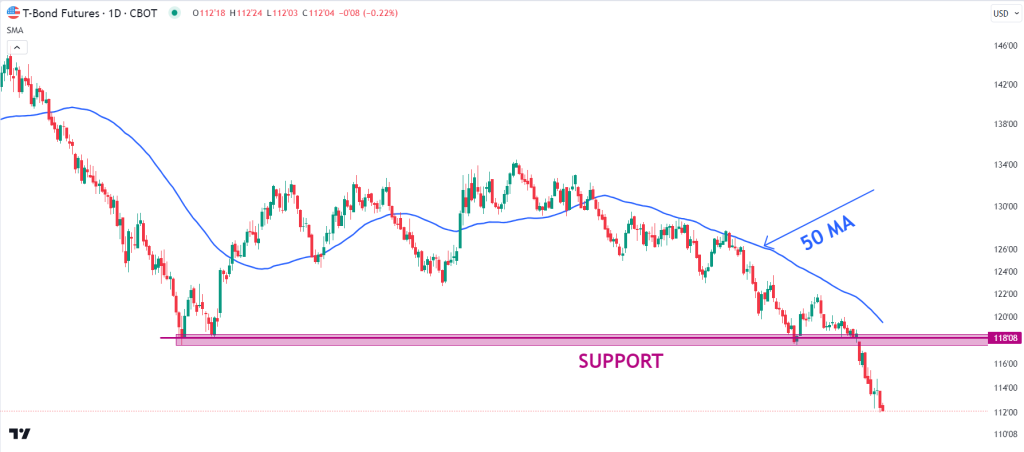
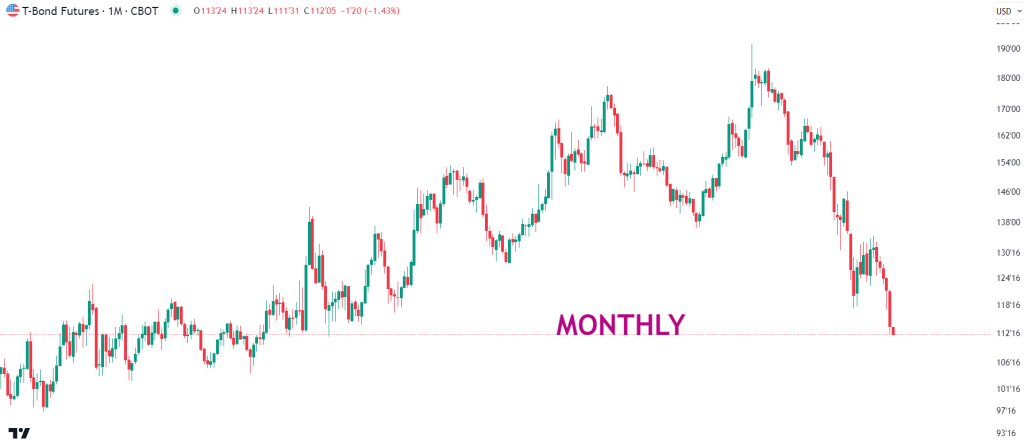
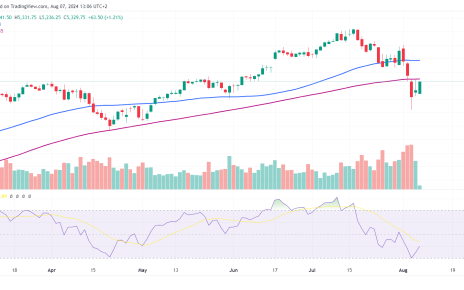
ZB has dropped to its lowest level since 2009 as Bond buying accelerates. Price is currently in no man’s land, and selling now could result in selling a bottom. For bulls, buying now would be trying to catch a falling knife.
ZB broke below the major support on September 20th and has been in a free fall ever since, with all retracements being sold short. At this point, there is no real way to set targets, as there are no support zones going down. We can set targets by using projections with indicators like moving averages or Bollinger bands, but they will likely not be very accurate.