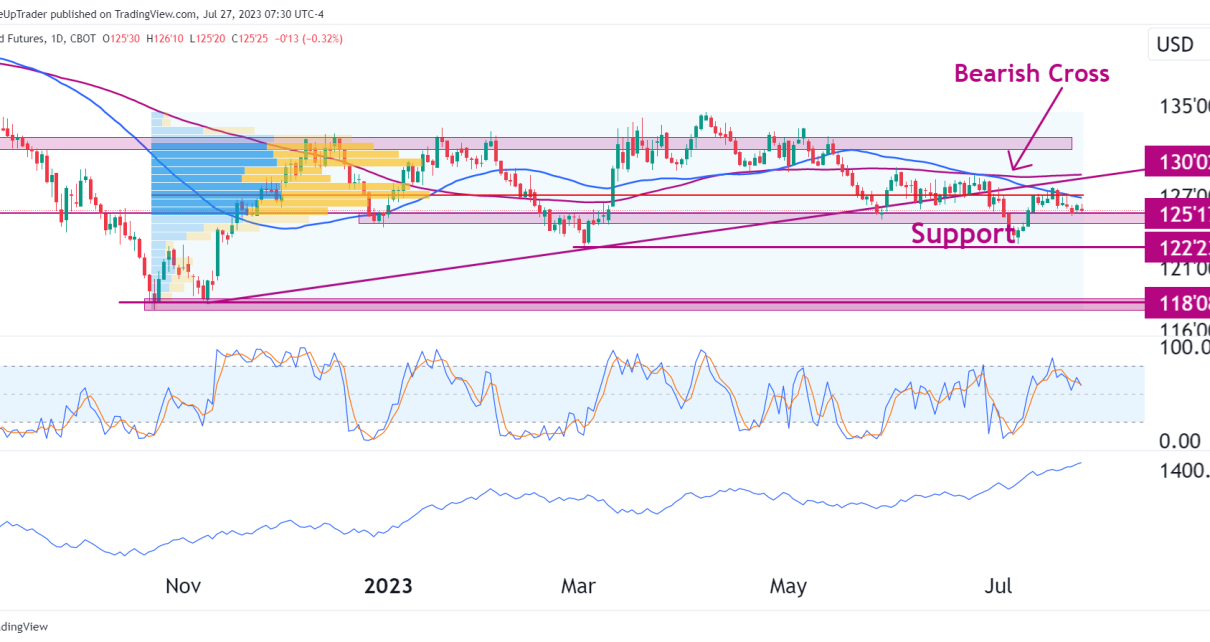
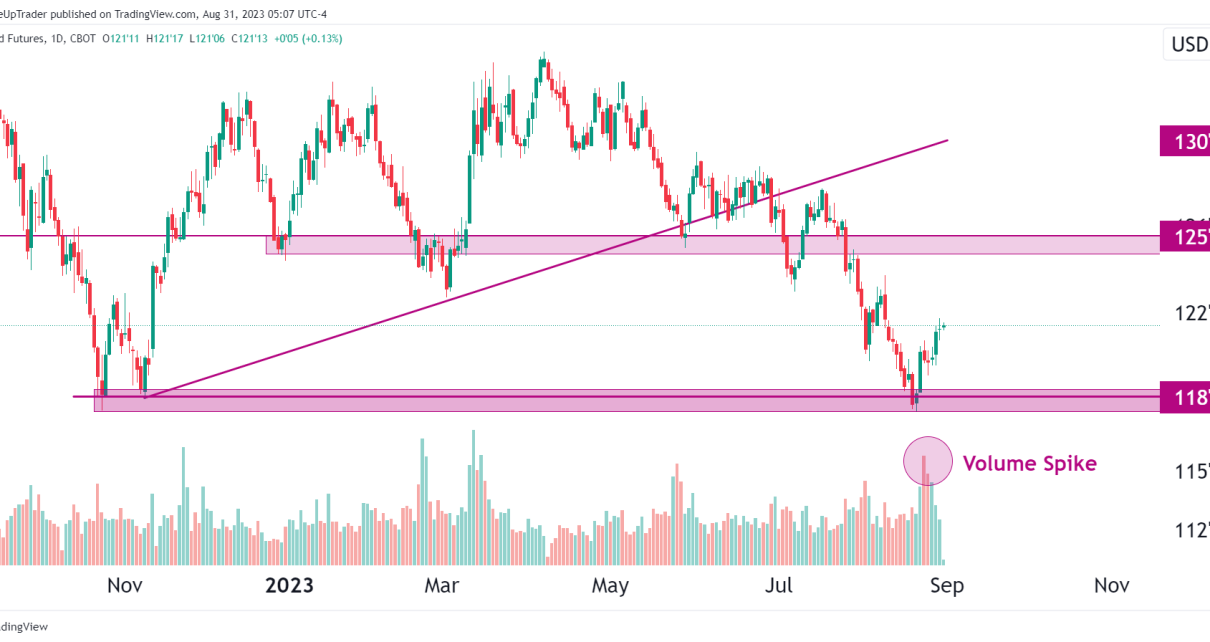
Technical Analysis

A fresh look at T-bond futures (ZB)

Introduction: Based on the daily chart, this technical analysis of T-Bond Futures (ZB) will examine the recent price movement, key technical indicators, and potential trading opportunities. Throughout the year, ZB has experienced relatively flat price action, lacking a clear trend. The 50-day moving average sloping downward and the price trading below it suggests the presence Read More…

Technical Analysis

Bullish opportunity presents itself in T-bond futures (ZB)

A fresh look at the technicals Ascending Triangle: There is an ascending triangle on the daily chart. This tells us that the market is forming a bullish bias. Price is currently testing the diagonal support line at 127’27. Capitulation Candle: There was a capitulation with a high volume spike at the low I pointed to on the Read More…

Technical Analysis

T-Bond Futures (ZB) bears take control

Introduction ZB futures have been in a steady downtrend since 2020 as investors buy more and more bonds. The sentiment remains that more buying will continue meaning we can expect yields to continue to drop, and that provides us with some useful opportunities we can take advantage of. Technical analysis There is a resistance zone Read More…

Crude oil and futures trading
Analysis Economics

Rising Oil Prices – Here’s What To Look Out For

Over the last few months, rising oil prices have many market participants’ attention. The chart below shows the price of oil, which peaked at the end of October 2021 and then fell about 25%. It bottomed in early December 2021 and hasn’t looked back. Oil broke through the Oct 2021 high of $85 a barrel Read More…