


Technical Analysis:
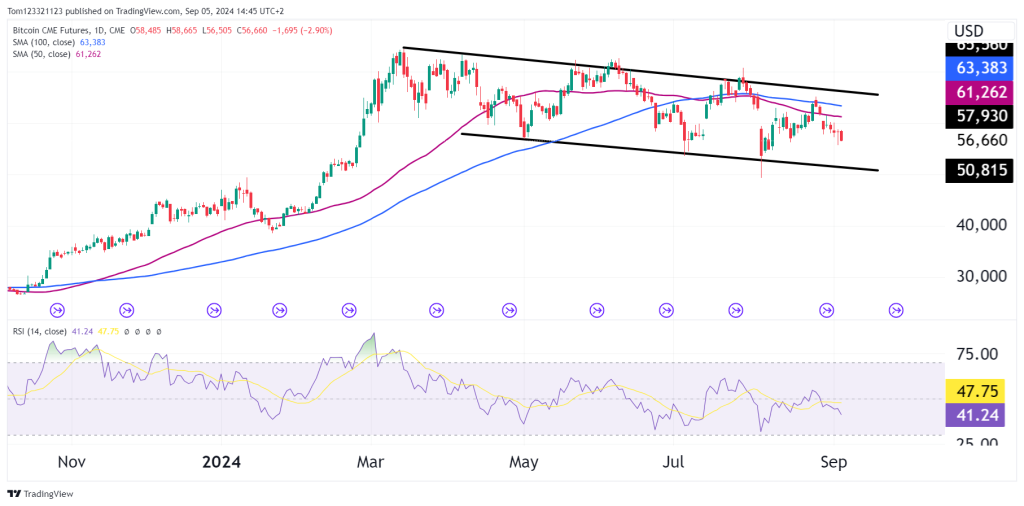
Descending Channel: The primary structure in play is a descending channel, which has kept price action constrained between roughly $75,000 and $50,815. Until Bitcoin can decisively break out of this channel, the prevailing trend remains slightly bearish in the medium term but still bullish in th belong term.
Potential Support Levels:
- $50,815: This is a critical support level, marked at the lower boundary of the descending channel. A breakdown below this level could open the floodgates for much lower prices, potentially driving Bitcoin into the mid-$40,000 range.
- $56,000 Region: This psychological and round-number level is providing some immediate support. A hold above this could result in short-term relief rallies, but the larger downtrend structure remains intact.
Short-Term Outlook:
In the short term, Bitcoin is hovering near a crucial support zone that, if it holds and the RSI dips further into oversold territory, we could see a technical bounce toward the $61,000 to $62,000 range, which coincides with the 50-day SMA and the mid-point of the channel. However, traders should remain cautious, as a failure to reclaim these levels would likely attract more selling pressure.
Medium-Term Outlook:
In the medium term, the key to watch is whether Bitcoin can break above the upper descending channel line, which is currently aligning with the 100-day SMA at $63,383. Until this occurs, the downtrend remains the dominant force, though it can also be basically sideways, and traders may look for opportunities to short rallies into resistance. There is also the potential for a big bull flag with the rally earlier this year being the pole and the channel being the flag formation.
On the flip side, if Bitcoin decisively breaks the $50,815 level, we could witness a stronger sell-off, and shorts may target lower support zones in the $45,000 region.
Long-Term Outlook:
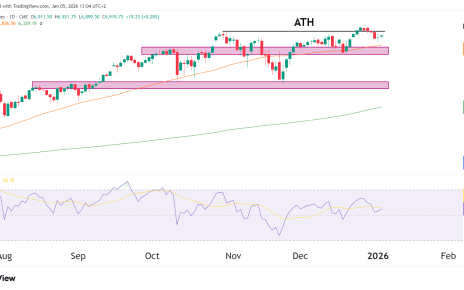
Despite the medium-term bearish structure, Bitcoin is still in a long-term uptrend when looking at a broader historical chart. The recent price action is more of a corrective phase within a larger bull market. Long-term investors may look at this descending channel as a potential buying opportunity if Bitcoin finds significant support at or below $50,000.
Conclusion: Trade Setup
- Bull Case (Short Term): A potential bounce from the $56,000 support could lead to a retest of the 50-SMA at $61,262, with the $63,383 level (100-SMA) as the next upside target.
- Bear Case (Short to Medium Term): If Bitcoin fails to hold above $56,000, a move down toward the $50,815 support level seems likely. A breakdown below this could trigger further bearish momentum toward the $45,000 area.
In the current environment, traders might favor shorting rallies near resistance, particularly at the 50-day and 100-day SMAs. However, it’s crucial to monitor for signs of reversal, especially if volume spikes occur near the lower boundary of the channel.
Risk management is key here, with stops recommended just above the 100-SMA for short positions, and near the $50,000 range for any potential long plays. As always, patience and discipline are paramount when trading Bitcoin’s high volatility environment.
Advanced traders may want to keep an eye on Bitcoin’s options market for implied volatility spikes as the price approaches the key levels mentioned above.