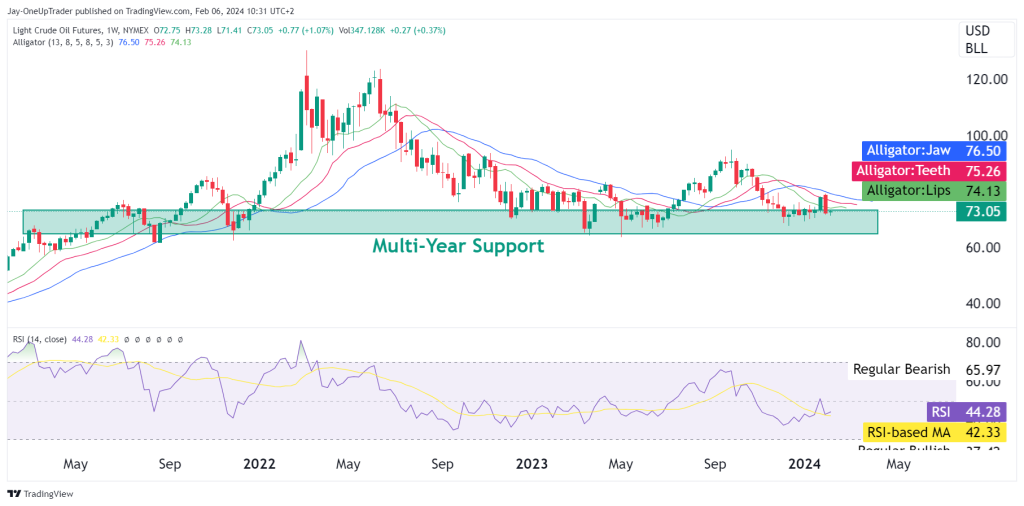
Weekly Chart:
The price action is hovering above an established multi-year support zone that is the main point for the bull’s case. The Alligator indicator shows the Jaw, Teeth, and Lips converging, signaling a potential consolidation phase. However, with the price maintaining levels above the Alligator’s Lips, we maintain a bullish outlook. The RSI is hovering near the mid-line, not indicating overbought or oversold conditions, which leaves room for upward movement.
Key Levels to Watch on the Weekly:
- Resistance: A firm close above $76.50 (Alligator Jaw) could pave the way for further gains in the long term (weekly time frame).
- Support: The multi-year support zone at $73 is critical. A decisive hold above this level strengthens the bullish narrative.
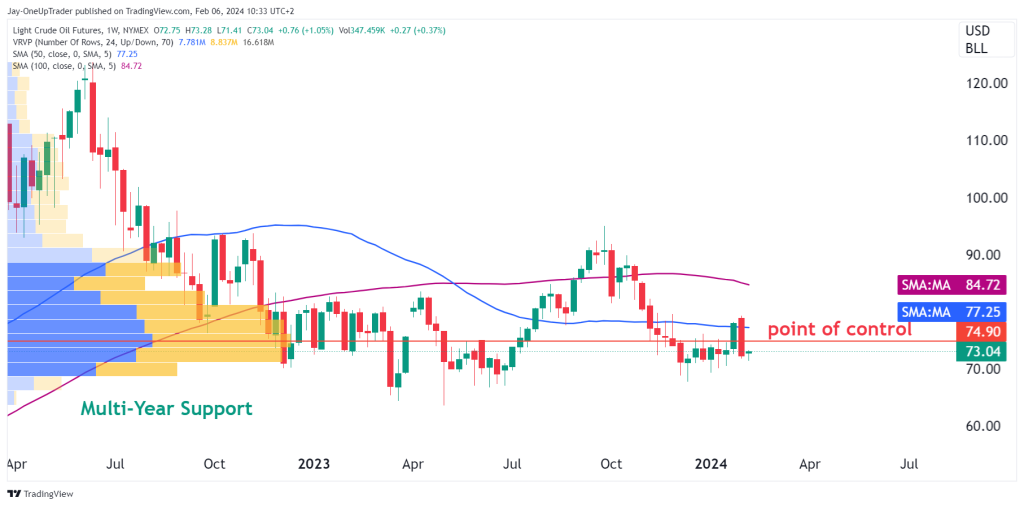
Daily Chart Observations:
If we look at the daily chart we can clearly see just how long the consolidation phase has lasted with CL hovering between $70 and $80, and the Volume Profile Visible Range (VPVR) showing a strong point of control around $74.90 which has been holding support.
Key Levels to Watch on the Daily:
- Resistance: The SMA (100) at $84.72 serves as the next target for the bulls.
- Support: The $73.04 level, just above the point of control, must hold to sustain bullish sentiment.
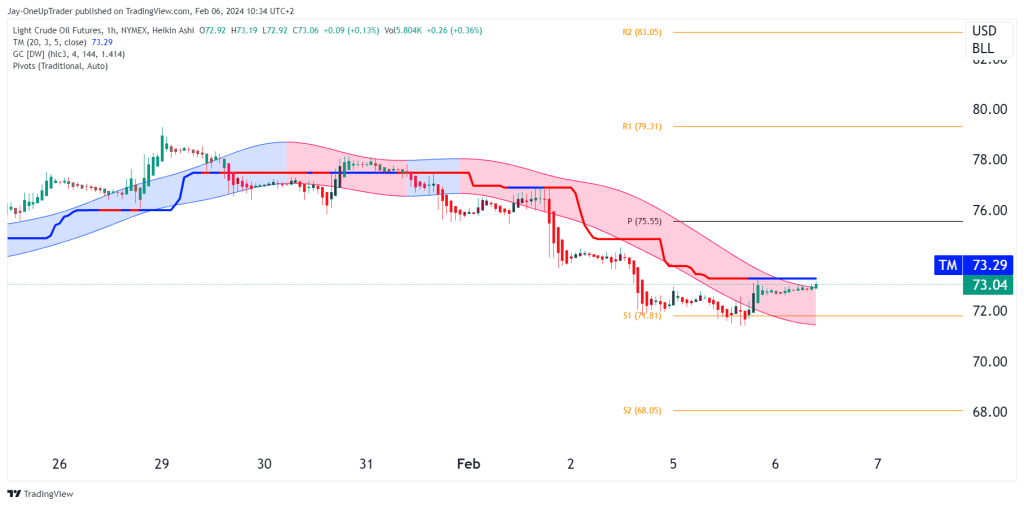
Hourly Chart Analysis:
The Heikin Ashi chart on the hourly timeframe reveals a tussle between buyers and sellers with a slight bearish bias as the price action is below the trend median (TM). However, the proximity to the pivot point (P) at $75.55 could invite a bullish takeover if we see a push above this level.
Key Levels to Watch on the Hourly:
- Pivot Points: Watch for a break above the pivot (P) at $75.55 for a short-term bullish entry.
- Support 1 (S1): At $71.81, we can anticipate buying interest to reemerge, making it a strategic level for long entries with a tight stop loss.
Potential Trades:
- Bullish Scenario: Enter long on a break and close above the pivot (P) at $75.55, with a stop loss just below the S1 level at $71.81 and a target of $79.31 (R1).
- Bearish Contingency: If we see a break below S1, consider short positions with a stop loss above the pivot (P) and a target set at the next support zone, S2 at $68.05.
Rating and Final Thoughts:
Our analysis rates the current Crude Oil Futures (CL) setup as Bullish. The steadfast hold above the multi-year support zone, coupled with the consolidation pattern near the point of control, strongly indicates that buyers are in control. The hourly chart suggests immediate resistance; however, a break above the pivot could lead to a swift bullish advancement. We recommend vigilance around the highlighted key levels, as a definitive break in either direction will likely set the tone for the next significant move. Keep an eye on momentum indicators for continued signs of bullish strength.