


Introduction
Dow Jones futures are fairing relatively well compared to its tech-heavy counterpart, with the industrial average only down 1.7% for the past month, while NQ is down a whopping 9%. This is not a ‘catch-up’ play either because of the different stocks that compose each index.
Since industrials are outperforming, there might be a long trade opportunity at the current level, but in order to get the best possible objective view on this YM chart, we need to keep NQ out of our analysis completely.
What is the daily chart telling us?
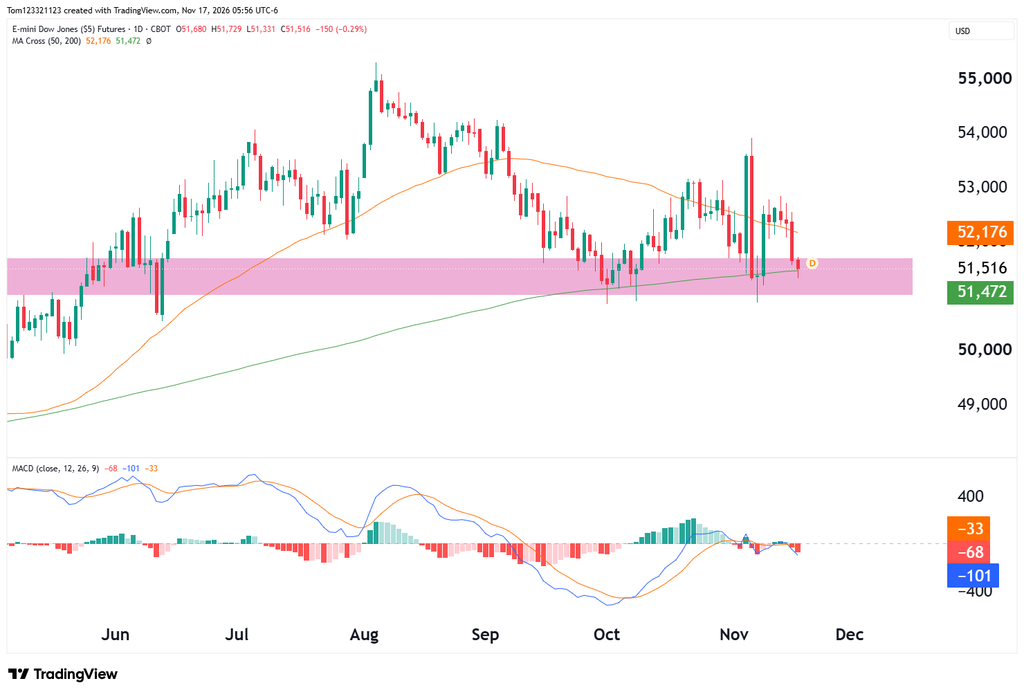
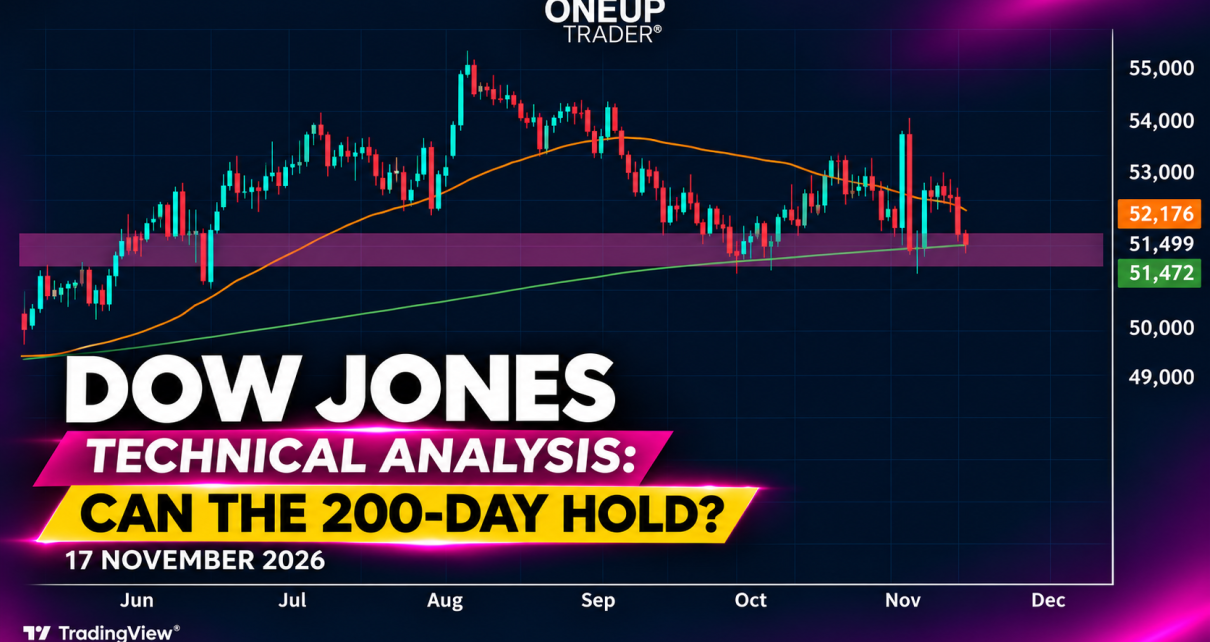
The pink support zone runs from roughly 51,000 to 51,700. In early October, YM briefly traded below its lower edge before recovering and eventually pushing above 53,000. This level is a strong support zone because it was the previous all-time high, which became resistance, then support, and price is busy testing it now.
Price is also sitting right in the middle of the 50 and 200 moving average but we can disregard the 50 for now. The 200 moving average is acting as support, and combining that with the support zone gives a stronger case for the bulls.
If NQ starts to recover, it will only aid in the possible bounce in YM. We can also look at it this way: If NQ continues to drop with more volatility, then it will make the YM bounce more difficult, but the move so far is not correlated, as we have seen, so it won’t mean it’s going to drop with it.
What would confirm a bounce or a breakdown?
For bulls, the first step is to recover 51,700 and defend it on a pullback. That would put the 50-day average near 52,176 within reach. A daily close above that average would strengthen the case for a move toward 52,700–53,000, where recent rallies have met sellers.
For bears, 51,000 matters more than a brief dip below the 200-day average. Several lower wicks show where sellers have pushed through the bottom of the zone without holding it. A daily close below 51,000, followed by a failed attempt to recover it, would be a different outcome and bring 50,000 into view.
Possible YM trades
Long setup: If YM clears 51,700, look for an hourly pullback that holds the level and forms a higher low. That low gives traders a place to define risk, with 52,176 as the first target. A move back into the pink zone would weaken the setup.
Short setup: If YM closes below 51,000, watch the first hourly rally back to that level. A rejection from underneath would give bears a setup toward 50,000, with risk defined above the rejection high. Given how sharply the Dow has reversed here before, the retest matters more than the first break.
For educational purposes only. Futures trading involves substantial risk, and stop orders do not guarantee an execution price.