

Introduction
Bulls and bears have been slogging it out on GC futures with no side taking the upper hand as the yellow metal has been trading in a sideways range since June. Gold rallied really hard from the start of 2024, almost 145%, which is the fastest and strongest rally that we have seen since 1980.
Now, the market is digesting that move and has been a difficult market to trade in the short term since the all-time high was made on the 29th of January.
Where will gold go now?
Gold technical analysis
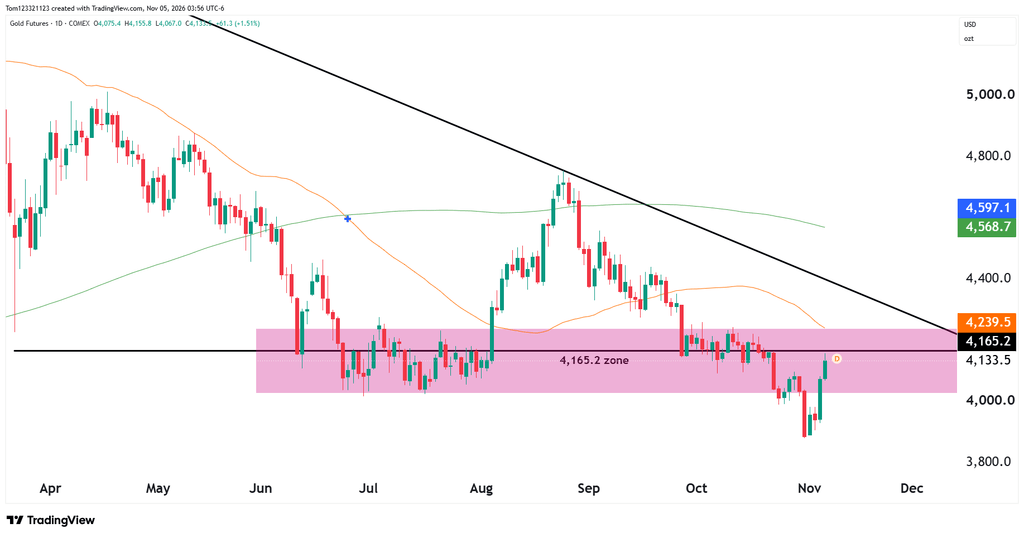
The most important technical level on the chart right now is the support zone, which has now turned into resistance at $4,165.2. Bears were able to push the price below this zone, and we got a big red bar close at 3,884.9, but that was the lowest the yellow metal has gone so far in this move. The next day reversed immediately and is now trading back into that zone, which has turned into resistance.
Possible Gold Trades
Long trade: For traders who see this as a false break, longs can be taken if price remains above the low of $3,884.9. Stop losses below that level, with targets set at the descending trend line on the chart.
Short trade: For traders who see this is as a retracement in a falling market, shorts can be taken in the zone with stops above the 50 moving average.
Disclaimer: Educational content only; no personalized investment or trading recommendation is intended. Futures carry substantial loss risk and may be unsuitable for some traders. Examples are hypothetical and do not predict results. Stop orders cannot guarantee an execution price. Evaluation requirements and payout terms vary and may change; consult the provider’s current rules.