reading time: 3 min
Introduction
It is time to start looking at the agricultural futures again, and today we are looking at corn futures.
Corn futures are correcting after the rally from the July low near 435’0. ZC closed 1 October at 502’0 (session range 498’2 to 503’0), below the 50 moving average near 507’0 and still above the 200 moving average near 490’2.
Holding 490’2 gives a possible long entry again. A break below it opens the prior consolidation between 480’0 and 460’0. A daily close back above 507’0 is the first sign the pullback is fading.
Daily Chart
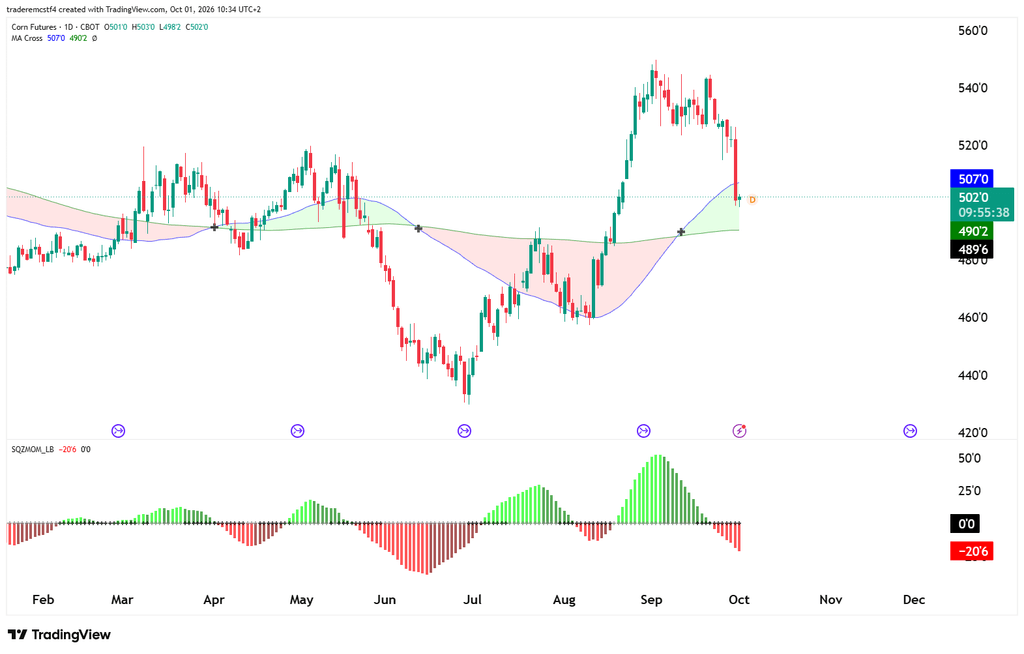
Key Levels To Mark On The Chart
| Level | Importance |
|---|---|
| 560’0 | Larger resistance ceiling |
| 550’0 | Early September swing high |
| 507’0 | Blue moving average; nearest resistance |
| 502’0 | 1 October close |
| 490’2 | Green moving average; first support |
| 480’0 to 460’0 | Prior consolidation if 490’2 fails |
| 435’0 | July swing low |
Possible Trades
Retest short: Rejection of 507’0 and an hourly lower high. Stop above the rejection high; targets 490’2 and 480’0.
Recovery long: Daily close above 507’0 and a retest that holds. Stop below the retest low; target near 550’0. Counter trend until momentum improves.
Support long: Hold of 490’2 with an hourly higher low. Stop below the green average; first target 507’0.
A failed retest of 507’0 offers the cleaner short risk definition than selling in the middle of the moving average gap.
This analysis is for educational and informational purposes only and does not constitute trading advice or a recommendation to buy or sell any futures contracts. Futures trading involves significant risk and may not be suitable for all investors. Always conduct your own research and consult with a licensed financial professional before making trading decisions.