Follow-Up: What Played Out Since August 6
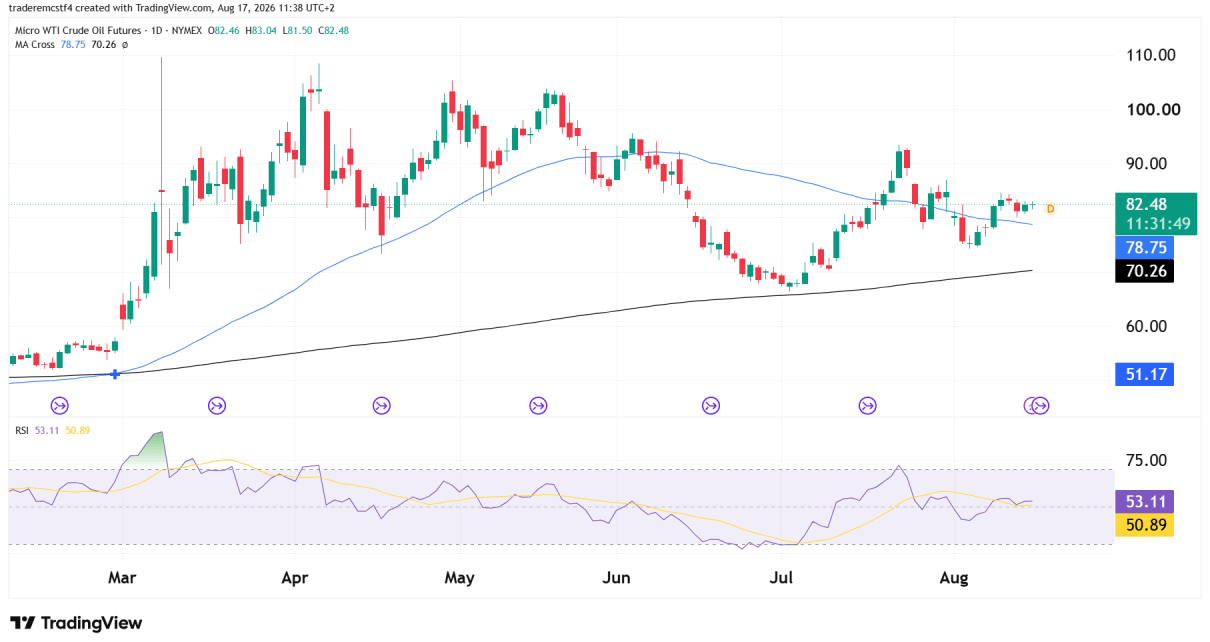
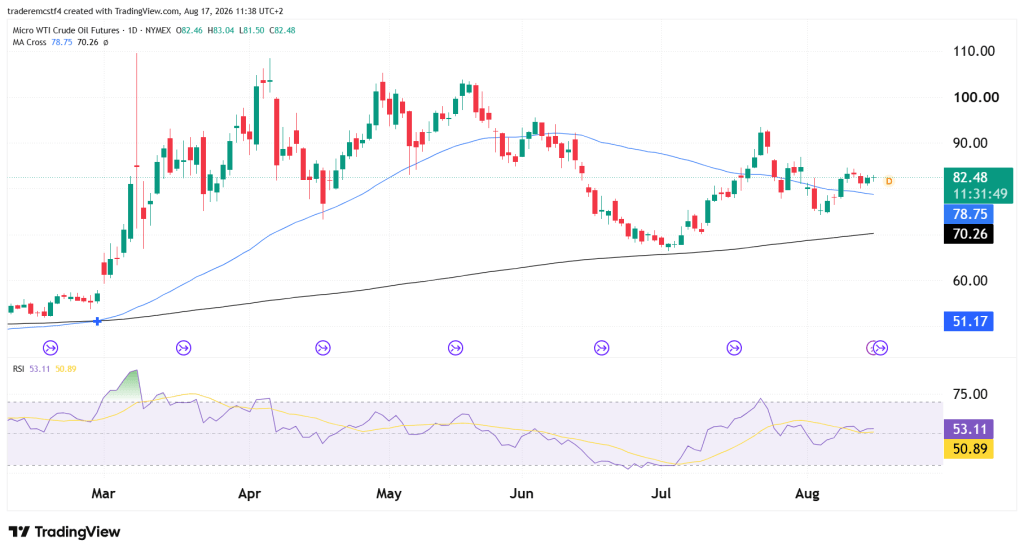
The caution we attached to crude on August 6 turned out to be the part that mattered. We flagged the 74.57–77.00 shelf as the zone to watch and noted that the Iran-Oman shipping agreement driving the sell-off was not finalized and could still swing either way. It swung. Tehran hardened its terms, the deal stalled, and oil has retraced the entire decline — from the 74.57 low to 82.53, a rally of roughly 10.7% across seven sessions. Both bounce targets we laid out, 79.85 and 82.00, have now been met.
The question is whether price can hold above the 82–83 pivot it keeps returning to, or whether this is simply the middle of a range that has swung 10% or more in both directions every few weeks.
The Hormuz Standoff, in Context
The rally is a mirror image of the decline, driven by the same story reversing. A few points worth flagging:
- The agreement that crashed prices fell apart. The U.S. and Iran had signed a memorandum of understanding on June 17 to open Hormuz to commercial shipping, but it collapsed over which routes vessels could use, followed by tanker attacks, U.S. airstrikes, and a reimposed naval blockade.
- Tehran has since hardened its position. Iran’s Foreign Ministry stated that conditions for reopening the strait do not exist while the U.S. naval blockade continues, and the Revolutionary Guards issued a list of demands that must be met first. WTI jumped about 5% on August 10 to close at $82.13 as those doubts spread.
- Washington’s messaging has not helped. President Trump described the U.S. as “only semi-negotiating” with Iran after asserting the prior week that talks were underway, and by August 12 prices had pushed above $83 as hopes of a reopening faded further.
The bigger picture: this is the supply-risk premium being repriced back in, not a demand story. Every level on this chart is subordinate to the next Hormuz headline, and traders should size accordingly rather than treating technical triggers as reliable in isolation.
Key Support and Resistance Levels
Major Resistance
| Level | Notes |
|---|---|
| 83.04 | Session high and the top of the recurring 82–83 pivot zone |
| 87.00 – 88.00 | Consolidation shelf from the early August decline |
| 92.00 – 93.00 | Early August high |
Major Support
| Level | Notes |
|---|---|
| 81.50 | Session low |
| 78.75 | Faster moving average, reclaimed on the rally back |
| 74.57 – 77.00 | The shelf that held on the August 6 test |
Possible Trades
Bullish continuation
- Entry trigger: daily close above 83.04
- Stop: below 78.75
- Target: 87.00–88.00 initial, 92.00 extended
Rejection at the pivot
- Entry trigger: daily close below 78.75
- Stop: above 83.04
- Target: 77.00 initial, 74.57 extended
Invalidation / range scenario
- Chop between 78.75 and 83.04 should be treated as the most likely outcome absent fresh headlines, given how often this zone has contained price since March
- The specific risk in this market is the gap move: a genuine breakthrough in negotiations or a fresh escalation can take price straight through a stop overnight, which argues for smaller size than a purely technical setup would justify
Summary
Crude has erased the entire early-August decline and is back at the 82–83 pivot it has returned to repeatedly since March, with the faster moving average reclaimed but still pointing lower. A close above 83.04 opens the 87–88 shelf and eventually the August high near 92, while losing 78.75 would put the 74.57–77.00 zone back in play. What has not changed is that the Hormuz standoff, not the chart, is setting the direction here.
Trading futures involves substantial risk of loss and is not suitable for all investors. Past performance is not indicative of future results. This analysis is for informational and educational purposes only and does not constitute financial advice. Always conduct your own due diligence and consult with a licensed financial advisor before making any trading decisions.