Introduction
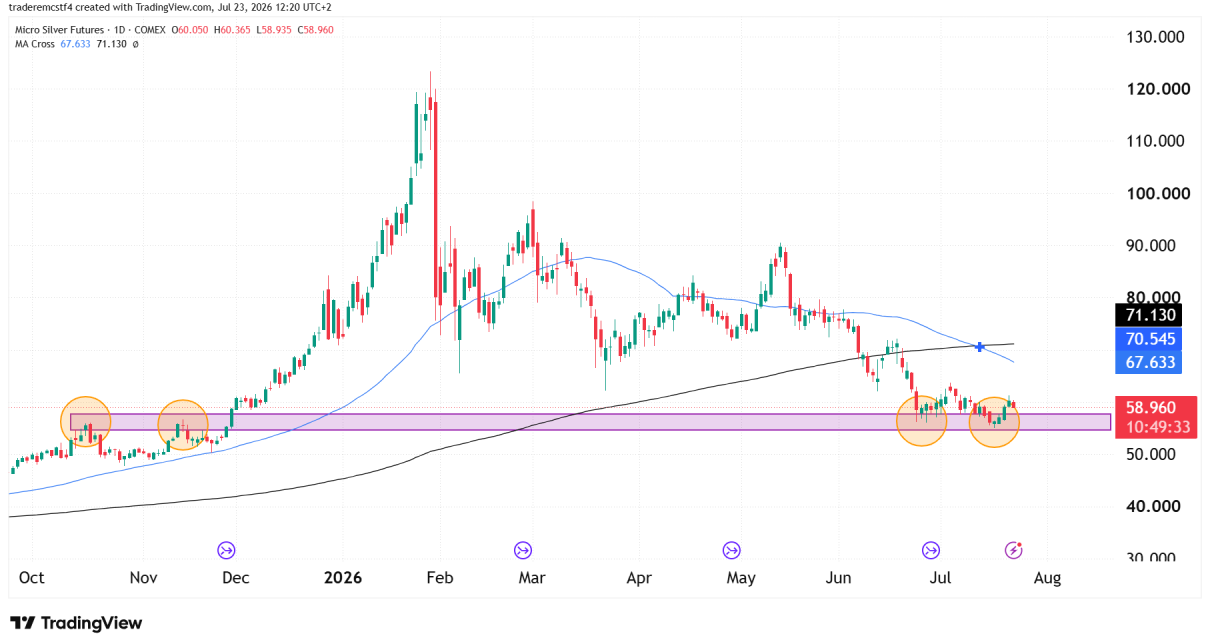
Silver is trading at $59 today, close to retesting a support zone that’s now been tested four separate times since last October — twice on the way up in November and December, and twice again this year after the sharp correction from January’s spike high near 122. It could be an excellent entry for longer term investors if the support level holds so lets dive into the technicals and see if there are any trades we can take.
Silver Futures Trend Analysis
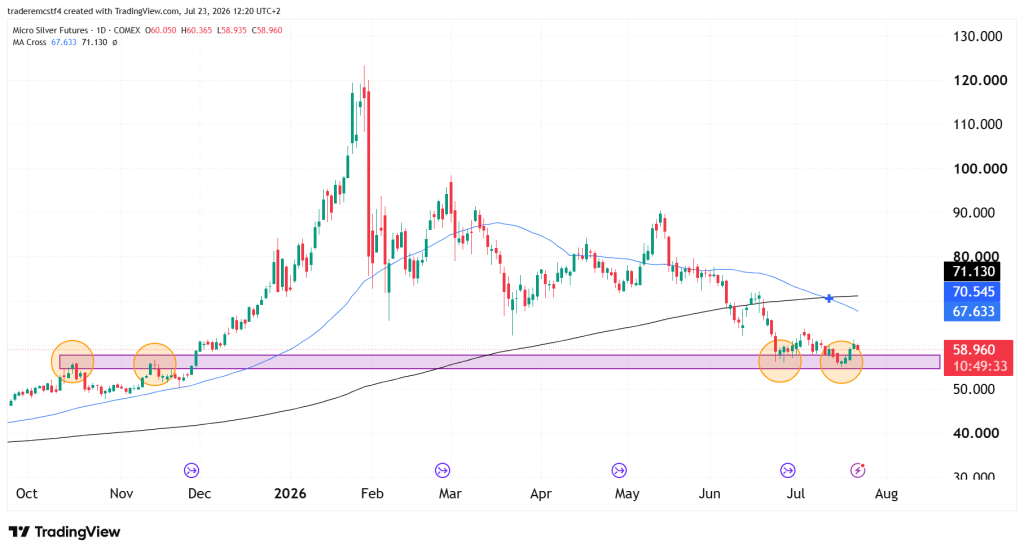
Silver spiked from the mid-40s in October to an all-time high near 122 by late January, then corrected hard, giving back roughly half that move over the following months. Price is now sitting right back in the 55–60 zone that acted as resistance before the breakout — a classic “return to the launch pad” setup.
Both moving averages are declining and converging, with the 50-day MA (67.64) now below the 200-day MA (71.13) — a bearish crossover on the medium-term trend. That said, price has bounced from lows near 55.71 earlier this week back up to 59.08 today, and the fact that this support zone has held on every test since October adds some weight to it holding again here.
What’s Driving the Fundamentals Right Now
Two separate forces are pulling in different directions, and it’s worth understanding both before reading too much into short-term price swings.
Supply and demand are structurally tight. The Silver Institute’s latest annual survey confirmed 2026 as the sixth straight year that mine supply has fallen short of total demand, with the shortfall running north of 46 million ounces. Silver is mostly mined as a byproduct of other metals, so production is driven more by demand for gold, copper, lead, and zinc than by silver’s own price — meaning supply can’t easily ramp up just because silver prices are elevated.
But demand has softened after the rally. This year’s sharp price run-up has already weighed on industrial usage, with some manufacturing sectors pulling back meaningfully on silver purchases, while investor buying has also cooled amid expectations that interest rates could stay elevated for longer.
Rate expectations just shifted, though. The latest CPI report came in softer than forecast, with annual inflation easing noticeably and core inflation cooling as well. Softer inflation reduces the case for further rate hikes, which would ease the real-yield pressure that’s been a headwind for silver.
Safe-haven demand is also back in the picture. Escalating tensions in the Middle East — including ongoing conflict and disruptions to regional shipping and energy infrastructure — have investors turning to precious metals for protection, even though higher rate expectations would normally work against a non-yielding asset like silver.
One more thing worth watching: the gold-silver ratio has widened meaningfully over the past couple of months, meaning silver has underperformed gold by a wide margin during this correction. That’s often watched as a signal of catch-up potential if broader precious metals sentiment turns bullish again.
Key Levels
| Level | Notes |
|---|---|
| 71.13 | 200-day MA |
| 67.64 | 50-day MA |
| 60.37 | Today’s high |
| 55–60 | Multi-tested support/resistance zone, four tests since October |
| 55.71 | This week’s low |
Possible Trades
Scenario 1: Support zone holds, bounce continues Given this zone has held on every test since October, and softer CPI plus safe-haven flows are providing some fundamental tailwind, a continuation of this week’s bounce is a reasonable near-term outcome.
- Entry: Bullish reaction within the 55–60 zone
- Stop: Below 55.00
- Target: 67.64 (50-day MA)
Scenario 2: Zone fails, deeper correction The medium-term technical picture is still bearish, with both moving averages declining and now in a bearish crossover. A clean break below 55 would be a genuine warning sign given how many times this zone has already been tested.
- Trigger: Daily close below 55.00
- Target: Reopens the case for a deeper move, with no major support until much lower levels from earlier in the rally
- Note: Weakening industrial demand is the fundamental risk that would support this scenario
Scenario 3: Range-bound chop within 55–67 Given the mixed fundamental picture — tight supply and safe-haven demand pulling one way, softening industrial and investor demand pulling the other — continued chop between the support zone and the 50-day MA is also plausible without a clear resolution either way.
Get 20% Off By Joining Our Discord!
This analysis is provided for educational and informational purposes only and should not be considered financial or trading advice. Trading futures, forex, and other leveraged financial instruments carries a high level of risk and may not be suitable for all investors. Past performance is not indicative of future results. Before making any trading decisions, conduct your own research, assess your risk tolerance, and consult with a qualified financial advisor if necessary.