Introduction
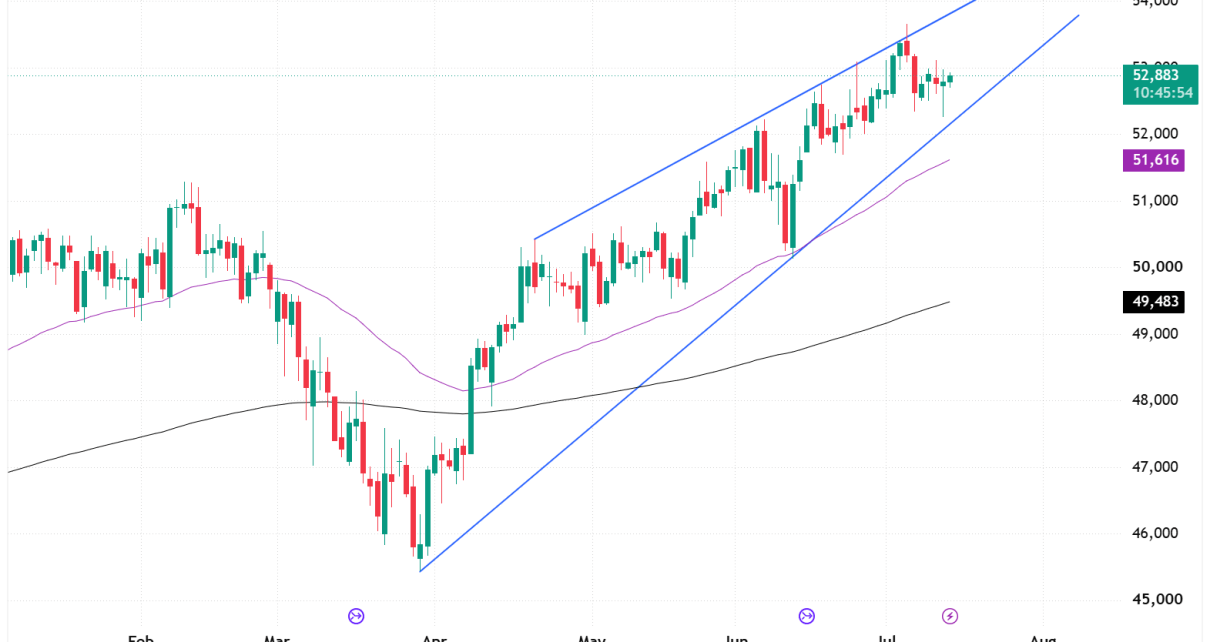
This is a follow-up to the 6 July analysis, where the call was for a shallow pullback after the breakout to new highs, with 52,500 and the 50-day MA flagged as the levels to watch for a bullish reaction. That’s largely played out — price pulled back after tagging the low-53,000s, held above 52,500, and is currently holding that. The rest of this week will be important for price action to see where YM is going.
What Played Out Since the Last Call
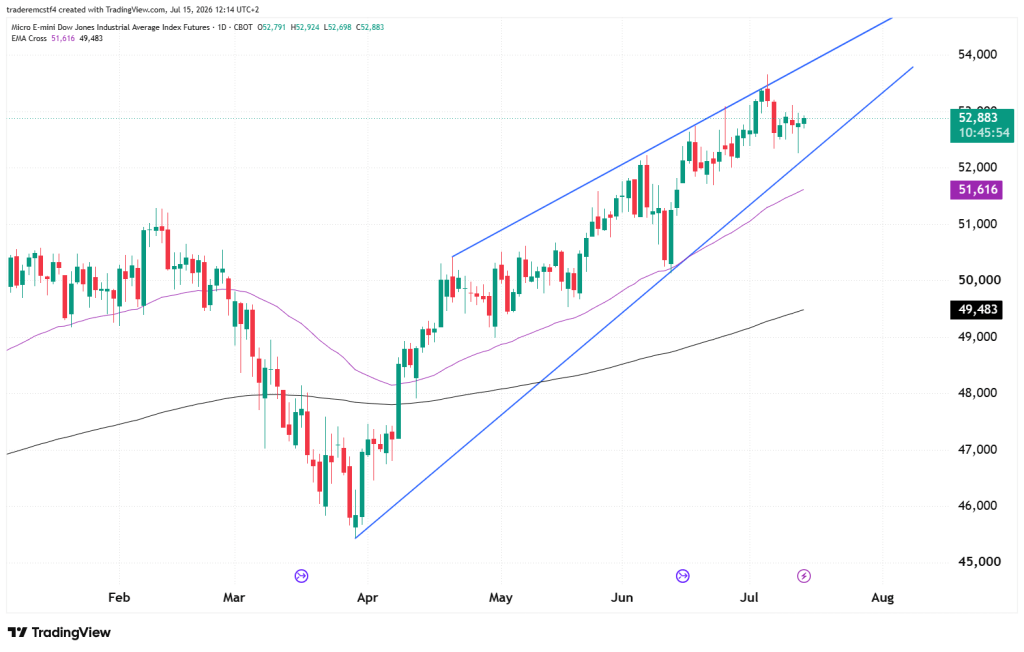
Price pushed as high as the low-53,000s before pulling back to test support in the 52,700–52,900 zone — well above the 52,500 level identified last time, meaning the pullback was even shallower than the base case. Price never came close to testing the 50-day EMA, which is now at 51,617 and well below current price.
Dow Jones Futures Trend Analysis
The bigger picture on this chart is the ascending channel running from the April low straight through to today. Price is currently sitting right at the underside of the upper channel trendline, at 52,901, after tagging a marginal new high and pulling back slightly. This is a different setup than the last analysis — instead of a support test, this is a resistance test at the top of a well-defined channel.
Traders need to keep an eye on this channel and keep in mind that the overall trend is bullish.
Key Levels
| Level | Notes |
|---|---|
| 54,000 | Upper channel trendline projection, next resistance if price breaks above the current test |
| 52,901 – 53,140 | Current price / recent high, right at the top of the rising channel |
| 52,500 | Prior breakout support, no longer being tested but still relevant if a deeper pullback develops |
| 51,617 | Rising EMA, held without being tested on this pullback |
| 49,483 | Longer-term EMA, confirms broader trend still intact |
Possible Trades
Scenario 1: Continuation higher within the channel (favored, given trend strength) With price still well inside the channel and the last pullback shallower than expected, the higher-probability path is a continued grind toward the upper trendline, currently projecting near 53,500–54,000.
- Entry: Bullish reaction on a break above 53,140, or a dip-buy near current levels while the channel structure holds
- Stop: Below 52,500
- Target: 53,500–54,000, where the upper channel trendline actually comes into play
Scenario 2: Pullback within the channel A normal consolidation back toward the middle of the channel or the rising EMA is a reasonable outcome given how far price has run, without threatening the broader trend.
- Entry: Bullish reaction near 52,500 or the 51,617 EMA
- Stop: Below 51,617
- Target: Back toward 53,140, then the upper trendline
Scenario 3: Channel breaks down Lower-probability near-term outcome given the trend strength shown, but the level that would need to hold for the broader uptrend to stay intact.
- Trigger: Daily close back below 52,500 and the rising EMA
- Implication: Would suggest the channel structure is breaking down rather than just consolidating
This analysis is provided for educational and informational purposes only and should not be considered financial or trading advice. Trading futures, forex, and other leveraged financial instruments carries a high level of risk and may not be suitable for all investors. Past performance is not indicative of future results. Before making any trading decisions, conduct your own research, assess your risk tolerance, and consult with a qualified financial advisor if necessary.