

Introduction
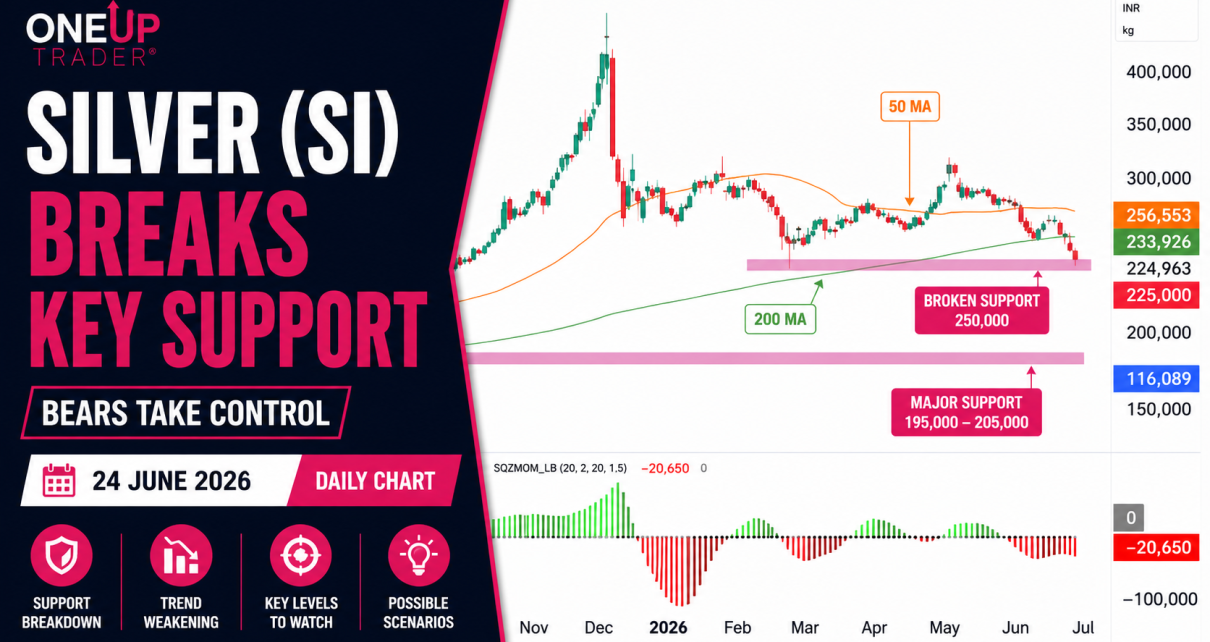
Silver futures have moved exactly where the risks were pointing in our June 4 analysis. At the time, we noted that buyers needed to defend the 250,000 ($25/oz) support area to maintain the longer-term bullish structure. Instead, silver continued drifting lower throughout June and has now broken beneath both the 250,000 level and the 200-day moving average. We have seen the same price action in gold futures.
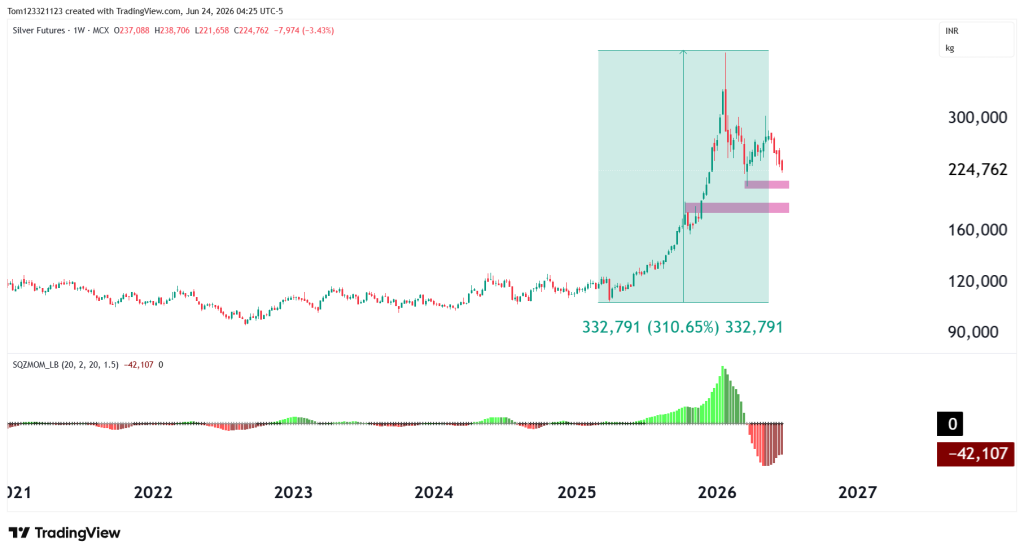
If we take a quick look at the weekly chart, the bulls are still in control but it is not out of the ordinary for the market to be pulling back because of the big 310% rally that we saw.
Let’s take a closer look at the technicals and what they tell us, as well as any possible trade opportunities.
Silver Futures Trend Analysis
Important Points
Current technicals show:
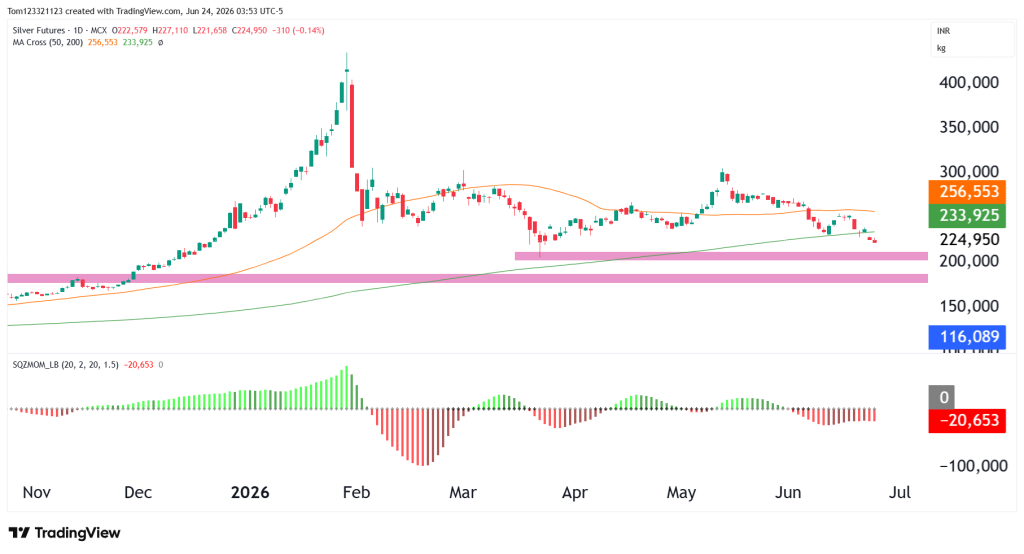
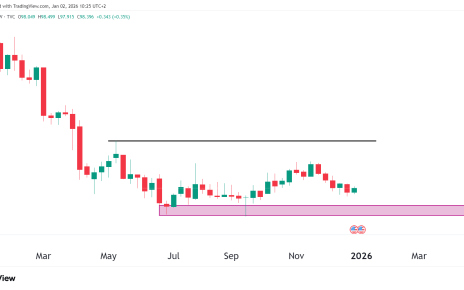
- Current price trading around 225,000 ($25/oz)
- 50-day moving average near 256,500
- 200-day moving average near 234,000
- Former support near 250,000 now acting as resistance
- Major support zone near 195,000–205,000
Back in early June, silver was trading comfortably between 250,000 and 290,000. The expectation was that the market would either continue consolidating or eventually break one side of the range.
Not only did silver lose the 250,000 floor, but it also failed to hold the 200-day moving average. That combination significantly weakens the technical picture because two major support levels have been lost within a relatively short period of time.
Momentum Continues Deteriorating
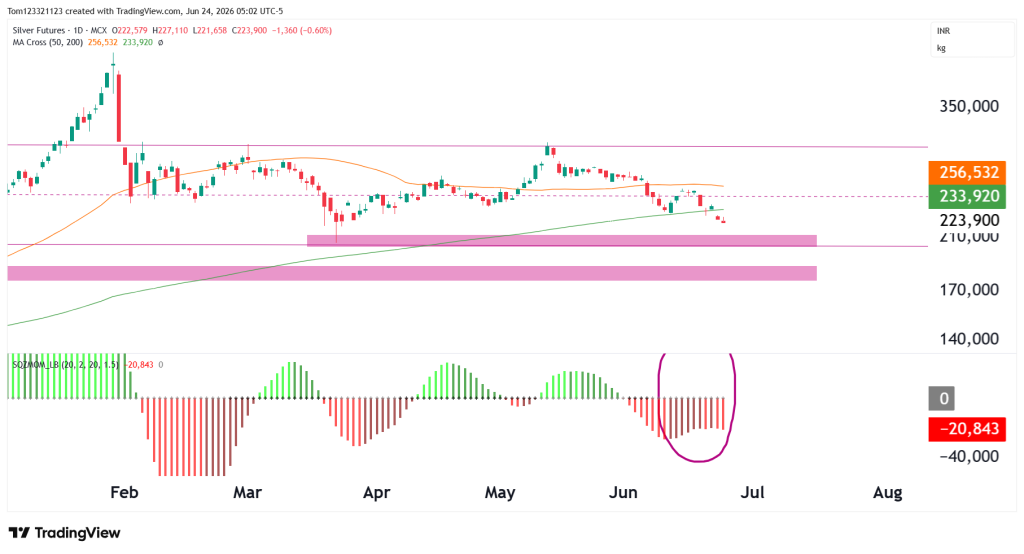
The momentum indicator is red and is now making lower lows on its histogram. This confirms the bearish price action that we have seen and will be an important indicator to watch going forward. If we suddenly see an uptick in the histogram bars, meaning that no more lower lows are formed and we start to see higher lows (see picture below), it could be a sign that the bullish momentum is coming back.
Estimated Probabilities for Silver Futures
| Scenario | Estimated Probability | Market Interpretation |
|---|---|---|
| Continued decline toward 200,000 support | 50% | Sellers maintain control following the breakdown |
| Consolidation between 220,000 and 250,000 | 35% | Market stabilizes after the recent selloff |
| Recovery back above 250,000 resistance | 15% | Buyers reclaim support and improve the outlook |
Key Support and Resistance Levels
Major Resistance Levels
- 234,000 (200-day moving average)
- 250,000 former support
- 256,500 (50-day moving average)
Major Support Levels
- 220,000 current support area
- 195,000–205,000 major demand zone
- 180,000 longer-term support
Silver Futures Possible Trades
Bearish Continuation Trade
This has become the primary scenario. As long as silver remains below both major moving averages and beneath the former 250,000 support zone, sellers maintain the technical advantage. A continued move toward the 200,000 region would not be surprising.
Consolidation Trade Setup
After several weeks of steady selling pressure, the market could begin building a temporary base above current levels. Consolidation would allow momentum indicators to reset before the next directional move develops.
Recovery Trade
For bulls, the first objective is reclaiming the 200-day moving average and then the former support zone near 250,000. Until that happens, rallies will likely continue being viewed as corrective moves within a broader downtrend.
This analysis is provided for educational and informational purposes only and should not be considered financial or trading advice. Trading futures, forex, and other leveraged financial instruments carries a high level of risk and may not be suitable for all investors. Past performance is not indicative of future results. Before making any trading decisions, conduct your own research, assess your risk tolerance, and consult with a qualified financial advisor if necessary.
